.svg)

Sep-2026
Sales
Trend
6-Month
Product Count
SKUs
Avg Price
YoY Sales Change
YoY Price Change


Where to Buy
Dr. Jolly's is stocked at 82 licensed dispensaries across Oregon, with the deepest coverage in Portland, Salem, Eugene, Medford, and Ontario. Search by ZIP code or city below to find the closest one, or filter by product type if you are after a specific format.
Market Insights Snapshot
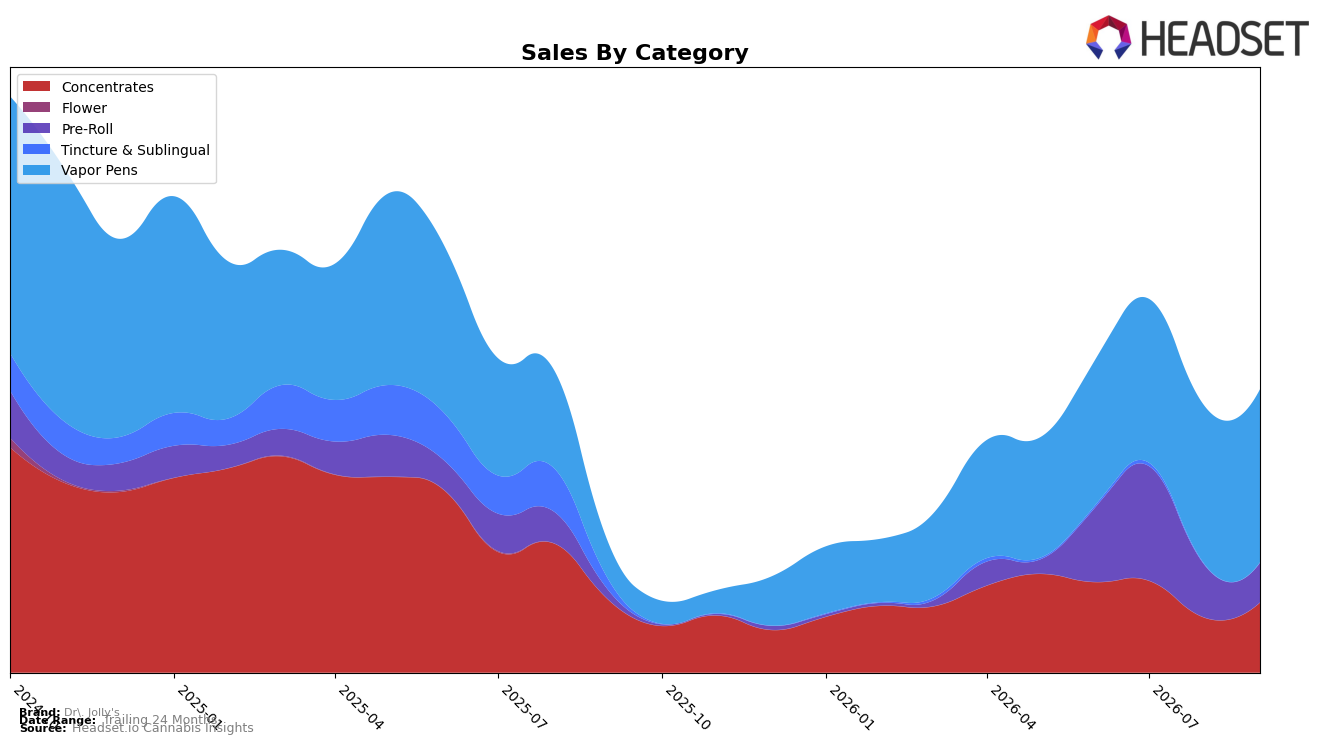
September 2026 shows Dr. Jolly's tilting heavily into Vapor Pens at 61.20% share with 373.65% year-over-year growth and 9.31% month-over-month, while Concentrates hold 24.72% share with a -4.02% year-over-year decline but a 27.67% month-over-month rebound. Pre-Roll sits at 13.95% share with 325.75% year-over-year growth but a -24.55% month-over-month pullback, and Tincture & Sublingual is down to 0.13% share with -96.61% year-over-year and -35.52% month-over-month. With brand-level sales up 118.76% year-over-year but average price down 16.10%, the pattern implies volume-led expansion concentrated in Vapor Pens, with Pre-Roll acting as a volatile secondary contributor and Concentrates providing near-term momentum but reduced annual weight.
The category shifts point to a positioning anchored in Vapor Pens where Dr. Jolly's holds rank 35 in Oregon, suggesting room to trade share upward as unit velocity rises at a 9.31% month-over-month clip while pricing in Vapor Pens averages $21.08 versus the brand’s $18.24 overall. The concurrent 27.67% month-over-month uptick in Concentrates alongside a -4.02% year-over-year drag indicates retention of a legacy base that can be reactivated through mix-priced offerings, while the -24.55% month-over-month dip in Pre-Roll after 325.75% year-over-year growth implies episodic wins rather than steady core demand; together, these moves imply a strategy to use lower average prices to acquire and convert shoppers into Vapor Pens as the anchor, with Concentrates as an upsell path and Pre-Roll as a promo-responsive spike channel.
Competitive Landscape
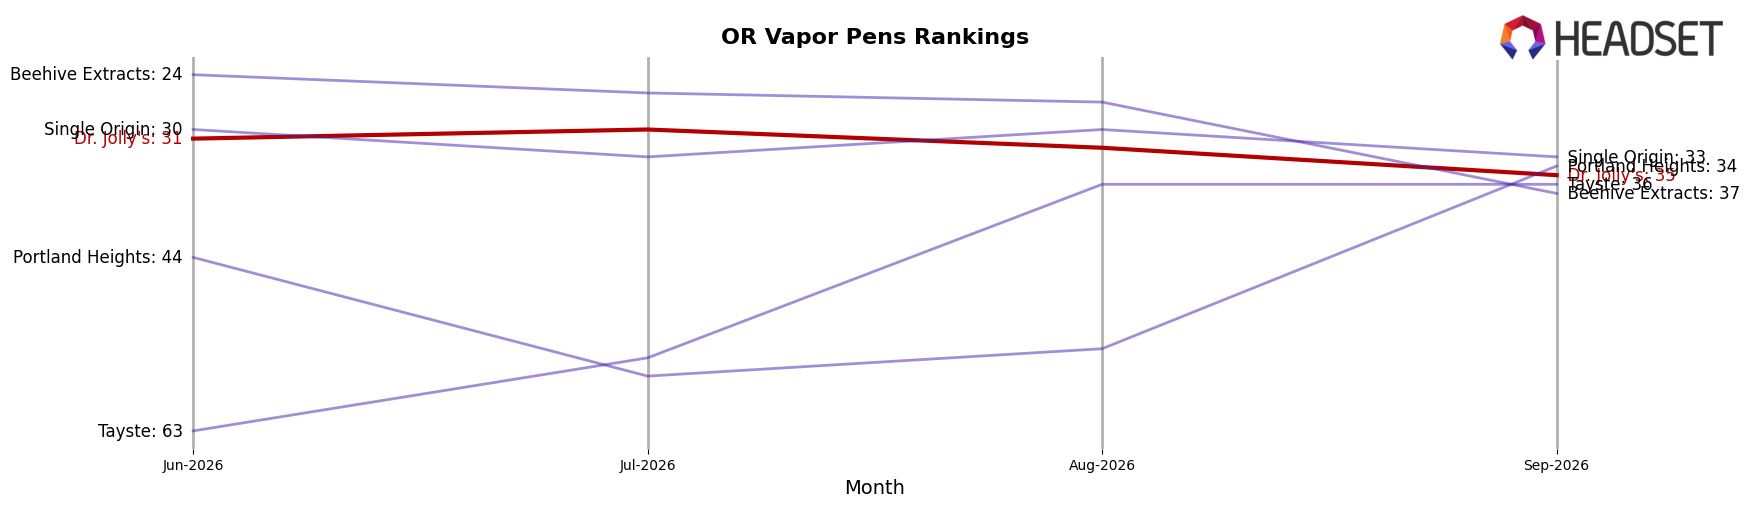
Dr. Jolly's sits at rank #35 in OR Vapor Pens in September 2026, improving 25 positions YoY from #60 and slipping 4 spots from June 2026’s #31, while still trailing its peak #23 from September 2024; meanwhile, Entourage Cannabis / CBDiscovery held #1 with a -15.2% YoY sales change and FRESHY climbed from #5 to #3 with +5.1% YoY sales, indicating that Dr. Jolly’s relative gain comes amid mixed momentum at the top and a faster-moving mid-tier. With a 25-place YoY climb but a 4-place quarter-over-quarter dip, the pattern implies recovery from a lower base but insufficient recent velocity to re-enter the top-25 without sharper share capture against advancing rivals.
Notable Products
GMO x Cap Junky Pre-Roll 10-Pack (5g) delivered the standout move in September 2026 with a +53.6% month-over-month jump to rank 3, while Orange Apricot Mac Live Resin Cartridge (1g) fell -24.1% to rank 7, indicating a split between accelerating multi-pack Pre-Rolls and cooling select Vapor Pens. Amherst Sour Diesel Live Resin Cartridge (1g) rose +18.8% at rank 5, and three Vapor Pens still occupied ranks 1, 2, and 4, so despite one double-digit decline the category maintained top-tier placement and dollar leadership at around $8.4k for Amherst Sour Diesel. With two Pre-Roll multi-packs posting +51.2% and +46.4% and landing within the top five, the concentration of multi-pack formats inside the top ten signals a pivot toward value-oriented pack sizes even as Vapor Pens retain premium ranking density.
Top Selling Cannabis Brands






Data for this report comes from real-time sales reporting by participating cannabis retailers via their point-of-sale systems, which are linked up with Headset’s business intelligence software. Headset’s data is very reliable, as it comes digitally direct from our partner retailers. However, the potential does exist for misreporting in the instance of duplicates, incorrectly classified products, inaccurate entry of products into point-of-sale systems, or even simple human error at the point of purchase. Thus, there is a slight margin of error to consider. Brands listed on this page are ranked in the top twenty within the market and product category by total retail sales volume.

