.svg)


Where to Buy
Panda (MO) is stocked at 108 licensed dispensaries across Missouri and Oklahoma, 101 of them in Missouri, with the deepest coverage in St. Louis, Kansas City, Springfield, Columbia, and Joplin. Search by ZIP code or city below to find the closest one, or filter by product type if you are after a specific format.
Market Insights Snapshot
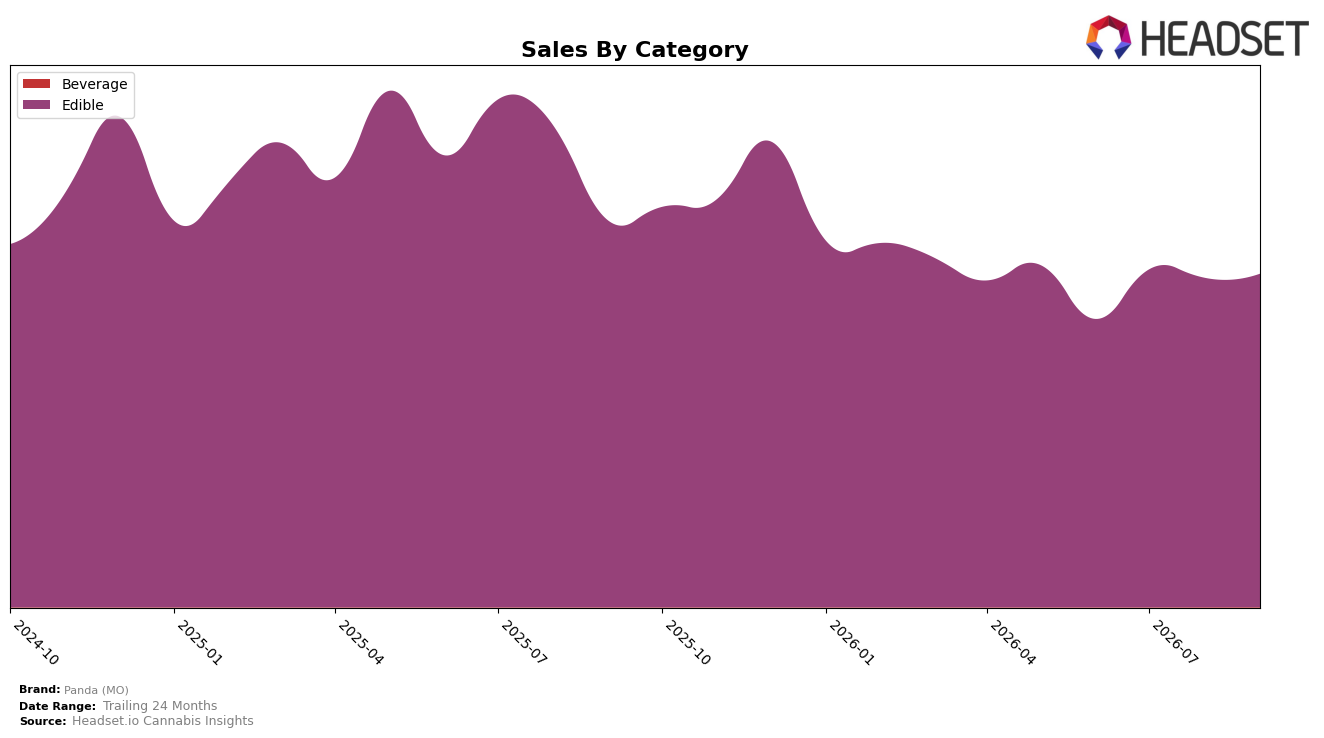
Panda (MO) concentrated 99.96% of September 2026 sales in Edible, with Edible up 1.22% month over month but down 13.80% year over year, while a nascent Beverage line held 0.04% share with a 35.10% month-over-month uptick from a negligible base. Overall brand sales fell 13.77% year over year alongside a 9.71% decline in average price to $20.53, indicating category-heavy exposure to Edible’s annual contraction despite a modest monthly lift.
With Edible anchoring the mix at 99.96% and an Edible rank of 8 in Missouri, Panda (MO) is positioned as a scaled segment specialist whose price-led tactics (-9.71% YoY on average price) are supporting short-term volume stabilization (+1.22% MoM in Edible) but not reversing annual share pressure. The 35.10% MoM rise in Beverage off a 0.04% share base suggests optionality rather than diversification today, implying the near-term path to share recovery hinges more on defending rank 8 in Edible and improving year-over-year trajectory than on material mix shifts in the next quarter.
Competitive Landscape
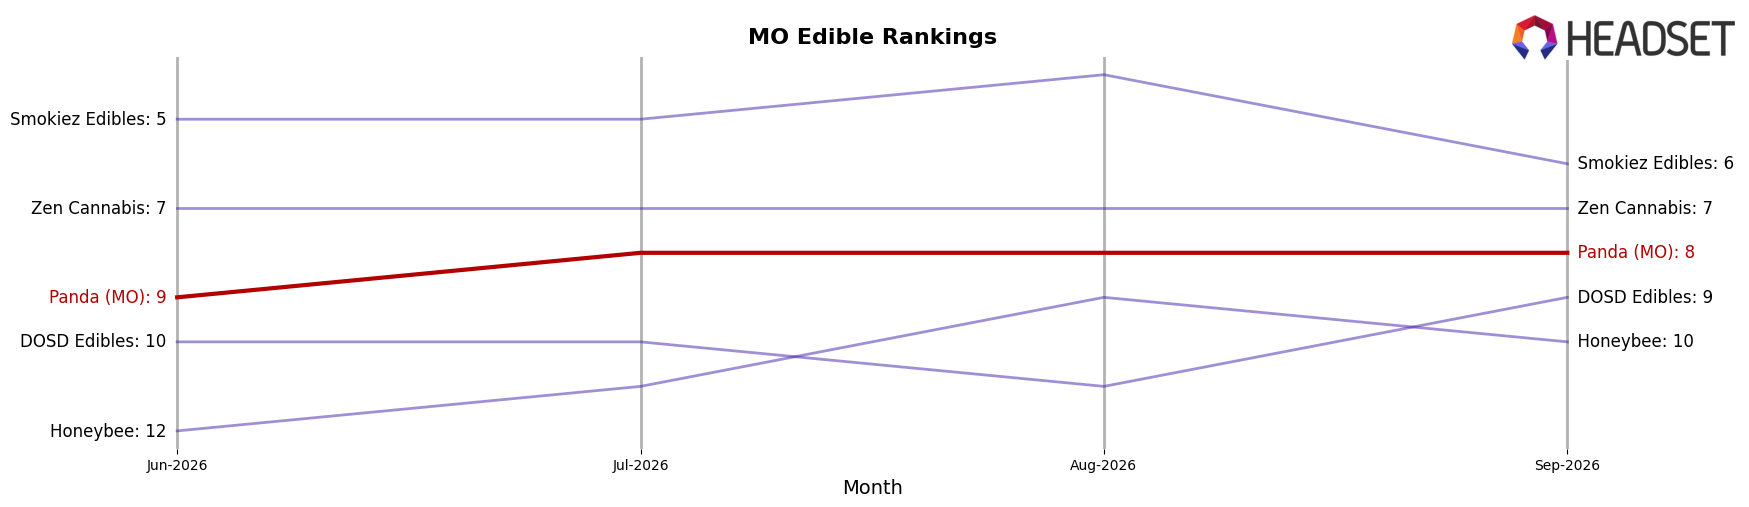
Panda (MO) sits at rank #8 in MO Edible in September 2026, unchanged YoY from #8, while its three-month position improved from #9 to #8; the brand’s historical ceiling remains #5 from July 2025, indicating a two-to-three slot gap from prior peak. Competitively, Good Day Farm rose from #2 to #1 with +12.98% YoY sales as Gron / Grön slipped from #1 to #2 with -19.82% YoY sales, and Good Taste climbed from #5 to #3 on +44.64% YoY growth, collectively compressing the path back to Panda (MO)’s prior #5 peak. The pattern implies Panda (MO)’s flat YoY rank alongside a modest three-month uptick leaves it dependent on displacements above—particularly volatility between #1–#3—to reclaim share rather than on internal momentum alone.
Notable Products
Black Cherry FECO Gummies 2-Pack (100mg) posted the steepest movement in September 2026, down 14.1% MoM while holding rank 1, and Mixed Berry FECO Gummies 20-Pack (500mg) also fell 14.1% at rank 4, signaling pressure at both the trial-size and high-potency ends. Meanwhile, Strawberry Lemonade FECO Gummies 20-Pack (100mg) rose 21.9% MoM at rank 5, but THC/CBN 1:1 Snoozeberry Fruit Gummies 20-Pack (100mg THC, 100mg CBN) slipped 8.2% at rank 2, hinting at a pivot from sleep-aid blends toward classic fruit FECO formats. Eight of the top ten are Edible gummies, and the Black Cherry FECO Gummies 20-Pack (100mg) at rank 6 declined 6.9% even as the category center held or grew in select SKUs, implying consumers are consolidating within mid-dose flavor variants rather than trading to extremes. The mix suggests Panda (MO) is tilting toward steady mid-dose gummy volume with selective flavor winners rather than relying on niche potency tiers or function-led formulations, concentrating revenue in scalable Edible lines.
Top Selling Cannabis Brands






Data for this report comes from real-time sales reporting by participating cannabis retailers via their point-of-sale systems, which are linked up with Headset’s business intelligence software. Headset’s data is very reliable, as it comes digitally direct from our partner retailers. However, the potential does exist for misreporting in the instance of duplicates, incorrectly classified products, inaccurate entry of products into point-of-sale systems, or even simple human error at the point of purchase. Thus, there is a slight margin of error to consider. Brands listed on this page are ranked in the top twenty within the market and product category by total retail sales volume.

