.svg)

Sep-2026
Sales
Trend
6-Month
Product Count
SKUs
Avg Price
YoY Sales Change
YoY Price Change


Where to Buy
Paul Bunyan is stocked at 120 licensed dispensaries across Illinois and Michigan, 105 of them in Illinois, with the deepest coverage in Chicago, Springfield, East Peoria, Anna, and Bourbonnais. Search by ZIP code or city below to find the closest one, or filter by product type if you are after a specific format.
Market Insights Snapshot
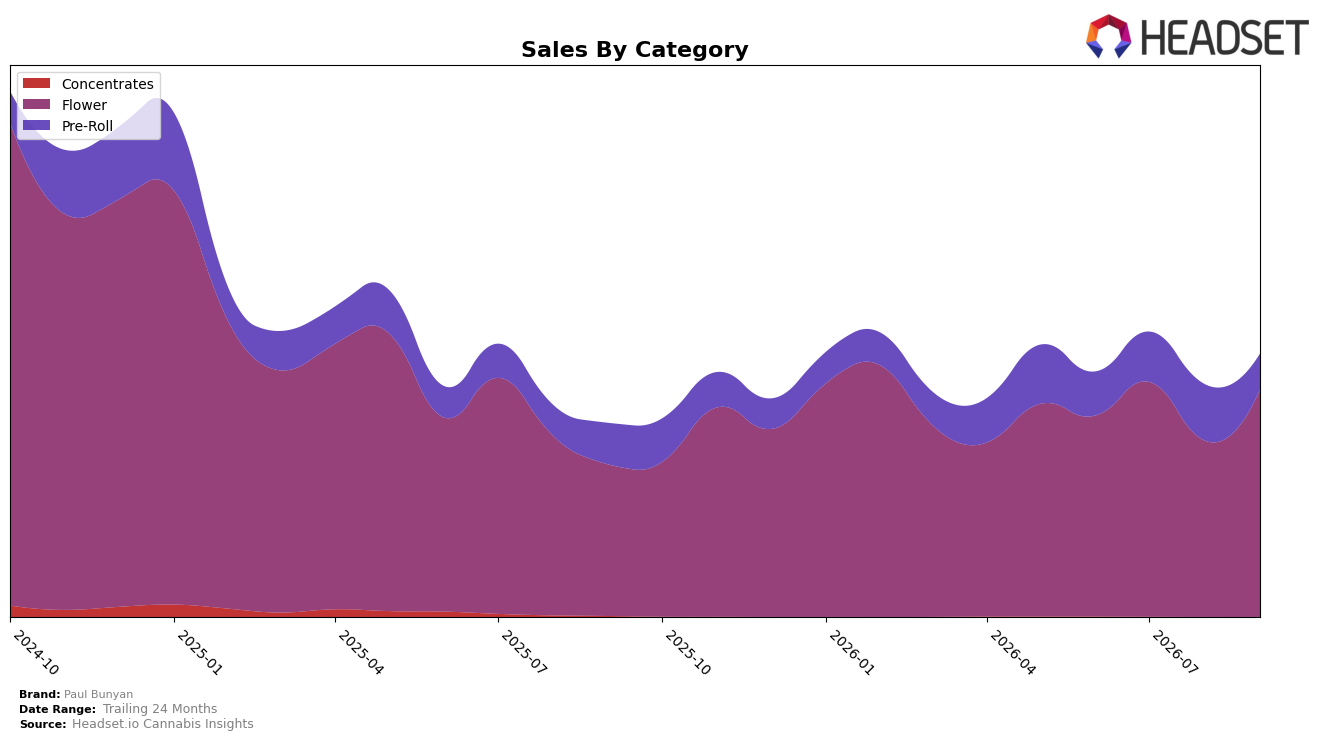
Paul Bunyan’s category mix in September 2026 was heavily concentrated in Flower at 86.46% share, with Pre-Roll at 13.54% share; within this, Flower sales grew 50.15% year over year while Pre-Roll declined 13.54% year over year. Month over month, Flower rose 28.98% while Pre-Roll fell 36.58%, and the overall brand posted 35.86% year-over-year sales growth alongside a 120.33% jump in average price; the 24-month sales change of -57.62% provides context that recent gains are reversing prior contraction. The pattern implies Paul Bunyan is pivoting hard into higher-priced Flower as the primary growth engine, while retreat in Pre-Roll compresses breadth and raises reliance on a single category for momentum.
Positioning-wise, an 86.46% Flower share paired with a 28.98% month-over-month climb suggests intentional allocation toward Flower-centric merchandising, and a 50.15% year-over-year lift in Flower against a 36.58% month-over-month pullback in Pre-Roll indicates deliberate de-emphasis of value-entry formats. With Flower ranked 20th in Illinois and average price up 120.33% year over year to $26.95, the mix tilt raises price-to-volume risk if Pre-Roll’s 13.54% share keeps shrinking. The implication is that sustaining rank in Flower while diversifying selective formats will be necessary to reduce volatility from category concentration and to convert price-led gains into durable share.
Competitive Landscape
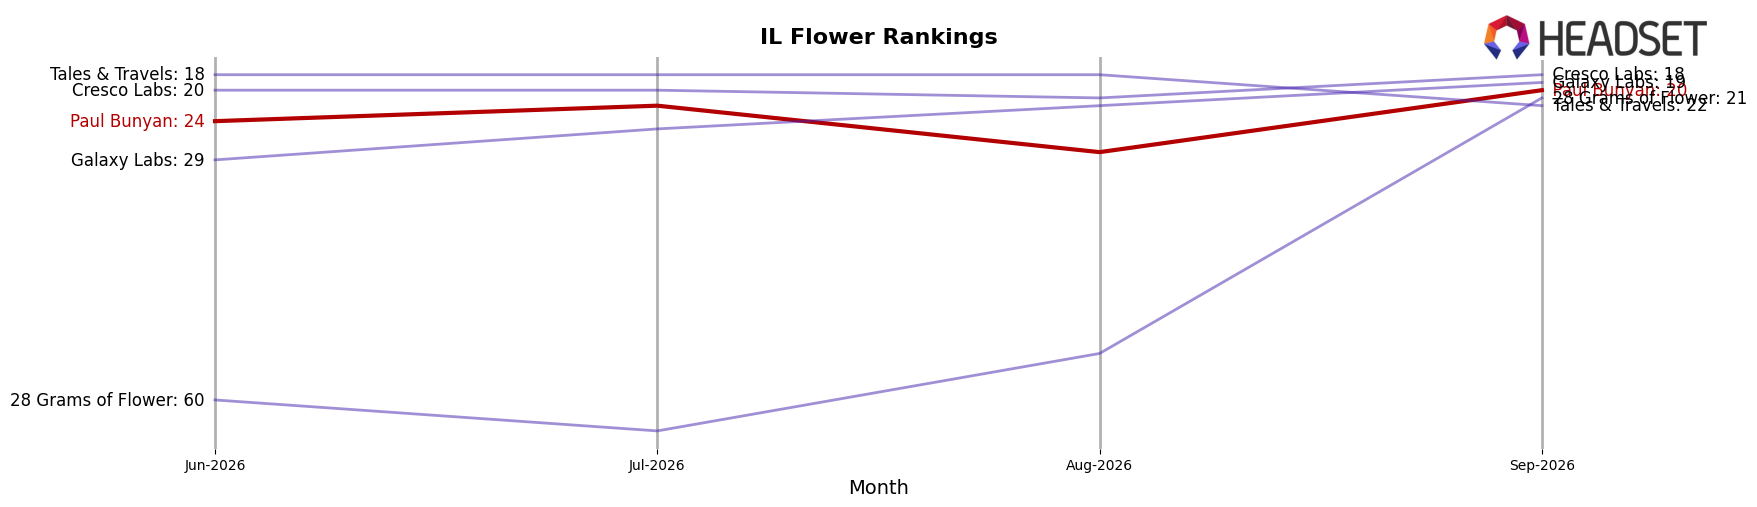
Paul Bunyan is ranked #20 in Illinois Flower in September 2026, improving 6 positions from #26 year over year, but slipping 4 spots from #16 over the last three months to #20 and sitting 10 places below its peak of #10 from September 2024. Competitive pressure is visible at the top: High Supply / Supply held #1 with a -2.5% year-over-year sales change, while RYTHM stayed at #2 with +22.0% year-over-year growth, and Good Green moved up from #4 to #3 with +33.8% sales growth; by contrast, Daze Off fell from #3 to #5 with -14.2% sales, indicating share is rotating toward faster growers. The combination of year-over-year rank gain (+6) and recent quarter slippage (-4) implies Paul Bunyan is consolidating mid-tier position rather than advancing toward prior peak, suggesting near-term stability but limited momentum without a catalyst.
Notable Products
Bubblegum Runtz Pre-Roll (1g) posted the steepest movement in September 2026 with a -21.7% month-over-month slide, dropping to rank 2 while Cocomamba Pre-Roll (1g) rose 44.4% to rank 1, flipping the order at the top. Sundae Driver Pre-Roll (1g) added 16.5% at rank 3 and Sour Soda Pre-Roll (1g) grew 20.5% at rank 4, while Purple Cobra Pre-Roll (1g) fell 38.1% to rank 7, meaning five of the top ten are Pre-Roll SKUs concentrated in the first four ranks. Apple Mamba (3.5g) entered at rank 5 with $17,311 and Summer Sangria (3.5g) followed at rank 6 with no month-over-month series yet, but the Pre-Roll block above them suggests velocity is consolidating in ready-to-smoke formats. The pattern implies Paul Bunyan is tilting assortment momentum toward fewer, faster-moving Pre-Roll leaders while Flower holds secondary, higher-ticket roles.
Top Selling Cannabis Brands






Data for this report comes from real-time sales reporting by participating cannabis retailers via their point-of-sale systems, which are linked up with Headset’s business intelligence software. Headset’s data is very reliable, as it comes digitally direct from our partner retailers. However, the potential does exist for misreporting in the instance of duplicates, incorrectly classified products, inaccurate entry of products into point-of-sale systems, or even simple human error at the point of purchase. Thus, there is a slight margin of error to consider. Brands listed on this page are ranked in the top twenty within the market and product category by total retail sales volume.

