Jun-2026
Sales
Trend
6-Month
Product Count
SKUs
Avg Price
YoY Sales Change
YoY Price Change
Market Insights Snapshot
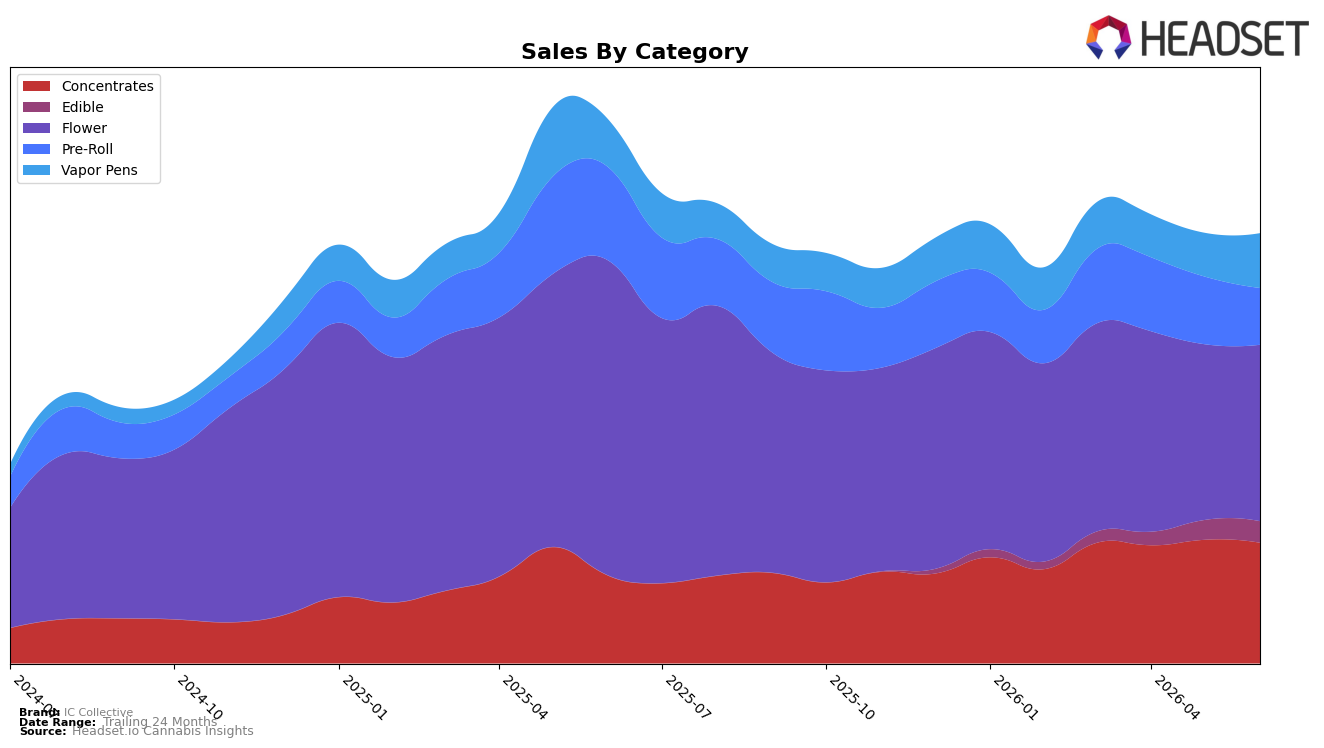
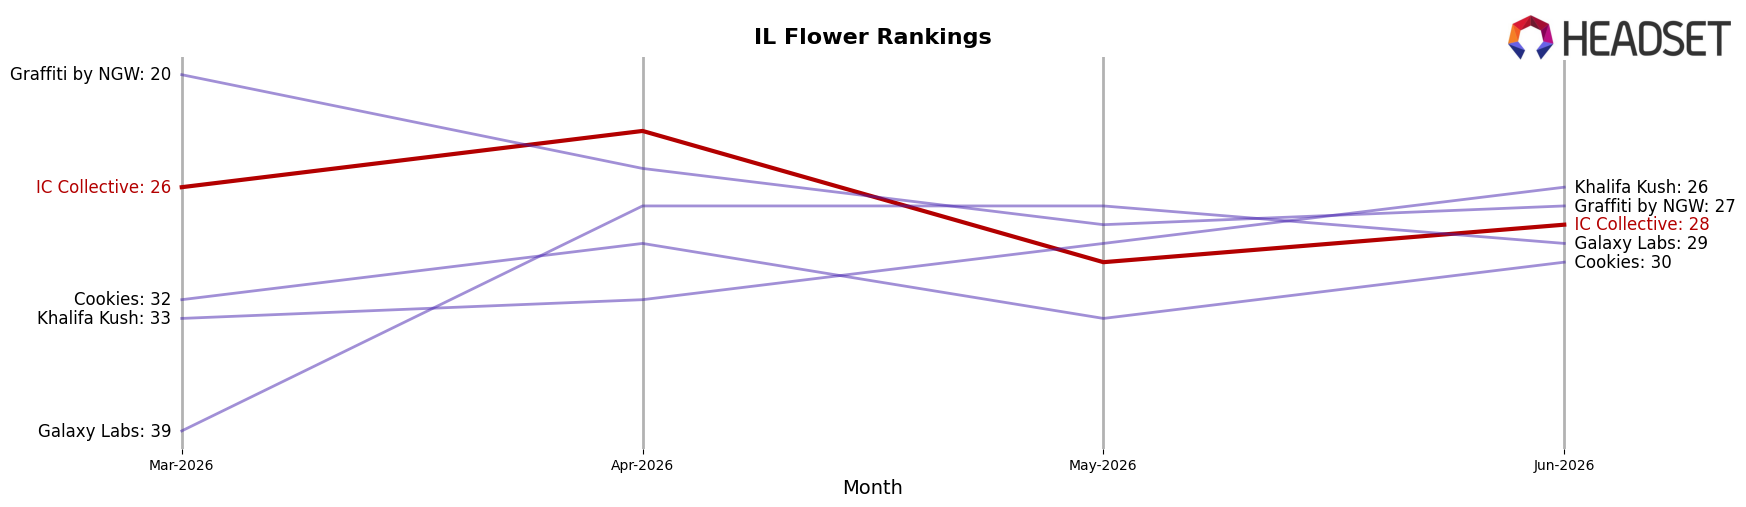
In June 2026, IC Collective’s mix tilted toward Flower at 41.06% share despite a 44.03% year-over-year decline and a 0.38% month-over-month uptick, while Pre-Roll fell to 13.17% share with a 39.25% YoY drop and a 16.16% MoM decline. Offsetting some of that contraction, Concentrates climbed 37.73% YoY to 28.09% share but slipped 2.40% MoM, and Vapor Pens rose 14.75% YoY and 25.46% MoM to 12.72% share; Edible added 8.95% MoM to 4.96% share with no YoY baseline. The brand’s average price fell 12.80% YoY to $35.34 while total brand sales declined 20.97% YoY, and in Illinois Flower ranked 28th, signaling that category-led headwinds, not just pricing, drove the YoY contraction.
The pattern implies a strategic pivot toward higher-velocity inhalable formats: Vapor Pens’ 25.46% MoM surge alongside a 14.75% YoY gain, paired with Concentrates’ 37.73% YoY growth but 2.40% MoM pullback, suggests near-term momentum is concentrating in cartridges rather than extracts, while Flower’s 44.03% YoY decline and Pre-Roll’s 16.16% MoM slide indicate a weakening reliance on raw plant formats. With Flower still at 41.06% share but ranked 28 in Illinois, reallocating shelf space from declining Flower and Pre-Roll toward Vapor Pens and stable Concentrates could improve rank trajectory, as the price reduction of 12.80% YoY did not prevent a 20.97% YoY sales fall, implying mix optimization carries more leverage than further discounting.
Competitive Landscape
IC Collective sits at rank #28 in Illinois Flower in June 2026, down 10 positions from #18 in June 2025, and has slipped 2 spots since March 2026 when it was #26; this contrasts with High Supply / Supply holding #1 year over year with a 32.1% sales increase and RYTHM steady at #2 despite a 5.2% sales decline, while Good Green advanced to #3 from #4 alongside a 30.9% sales lift. IC Collective’s peak of #18 in June 2025 and current #28 position indicate a 10-rank erosion while competitors like &Shine moved up to #5 from #10 with a 28.5% sales gain, implying that IC Collective’s relative demand share is compressing and the brand risks further shelf displacement if the rank slide from #26 to #28 over the last three months continues.
Notable Products
Lemon Diablo Pre-Roll (1g) saw the steepest decline at -31.4% with a rank of 7, while T.I.T.S.(3.5g) fell -32.7% to rank 8, together signaling inventory or velocity pressure in traditional inhalables. Offsetting that, Tangerine Lemonade Live Rosin Gummies 5-Pack (100mg) jumped 62.3% to rank 4 and OMFG (3.5g) rose 54.7% to rank 2, indicating mix shift toward a bifurcated basket where edibles and a single flower hero outpace weaker pre-rolls. With six of the top ten coming from the Pre-Roll category yet posting movements as wide as +1.7% at rank 1 and -12.8% at rank 4, concentration is high but stability is low. This pattern implies IC Collective is pivoting commercial emphasis toward a dual-core of premium flower and live rosin edibles while pruning volatile pre-roll SKUs.
Top Selling Cannabis Brands
Data for this report comes from real-time sales reporting by participating cannabis retailers via their point-of-sale systems, which are linked up with Headset’s business intelligence software. Headset’s data is very reliable, as it comes digitally direct from our partner retailers. However, the potential does exist for misreporting in the instance of duplicates, incorrectly classified products, inaccurate entry of products into point-of-sale systems, or even simple human error at the point of purchase. Thus, there is a slight margin of error to consider. Brands listed on this page are ranked in the top twenty within the market and product category by total retail sales volume.

