Market Insights Snapshot
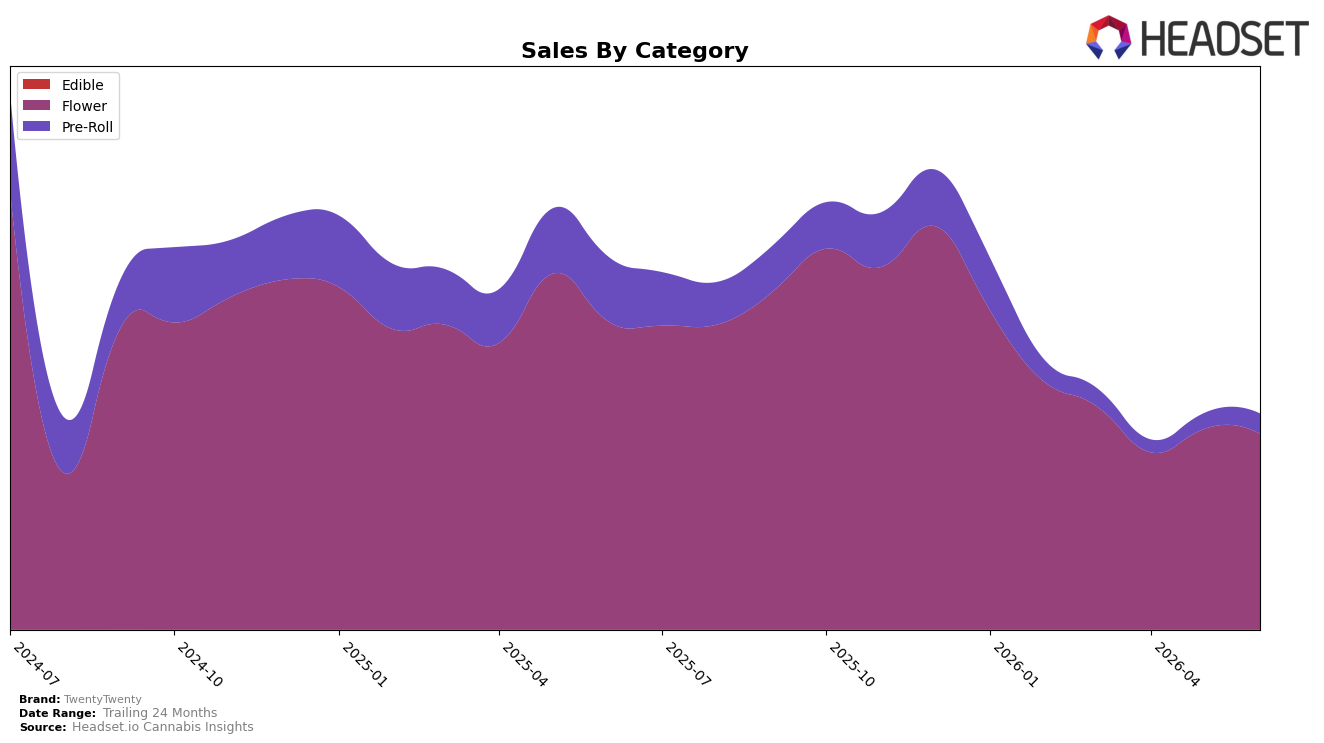
In June 2026, TwentyTwenty concentrated 90.75% of sales in Flower with a year-over-year decline of 36.50% and a month-over-month dip of 2.43%, while Pre-Roll held 9.25% share with a 69.05% year-over-year drop but a 26.85% month-over-month rebound. The brand’s average price fell 4.21% year over year to $22.78, contrasting with Flower’s higher average price at $25.11 and a lower-priced Pre-Roll at $11.90, indicating mix pressure from premium-weighted Flower despite Pre-Roll’s short-term uptick. TwentyTwenty’s Flower rank at 21 in Missouri and a brand-level year-over-year sales decline of 42.13% together imply that heavy reliance on Flower limits recovery speed even as Pre-Roll shows tactical month-on-month momentum.
The concurrent 26.85% month-over-month lift in Pre-Roll against a 2.43% month-over-month decline in Flower and a 69.05% year-over-year Pre-Roll contraction suggests that TwentyTwenty’s near-term trial is occurring in value-accessible formats without yet restoring the prior-year scale. With 90.75% of the mix anchored in Flower and a 36.50% year-over-year decline there, the brand risks overexposure to a softening core, while the 9.25% Pre-Roll share offers a lever for traffic and pricing insulation given the 4.21% brand-wide price deflation; the pattern implies a need to rebalance toward formats that can convert the Pre-Roll month-over-month engagement into sustained share without eroding the Flower position tied to rank 21 in Missouri.
Competitive Landscape
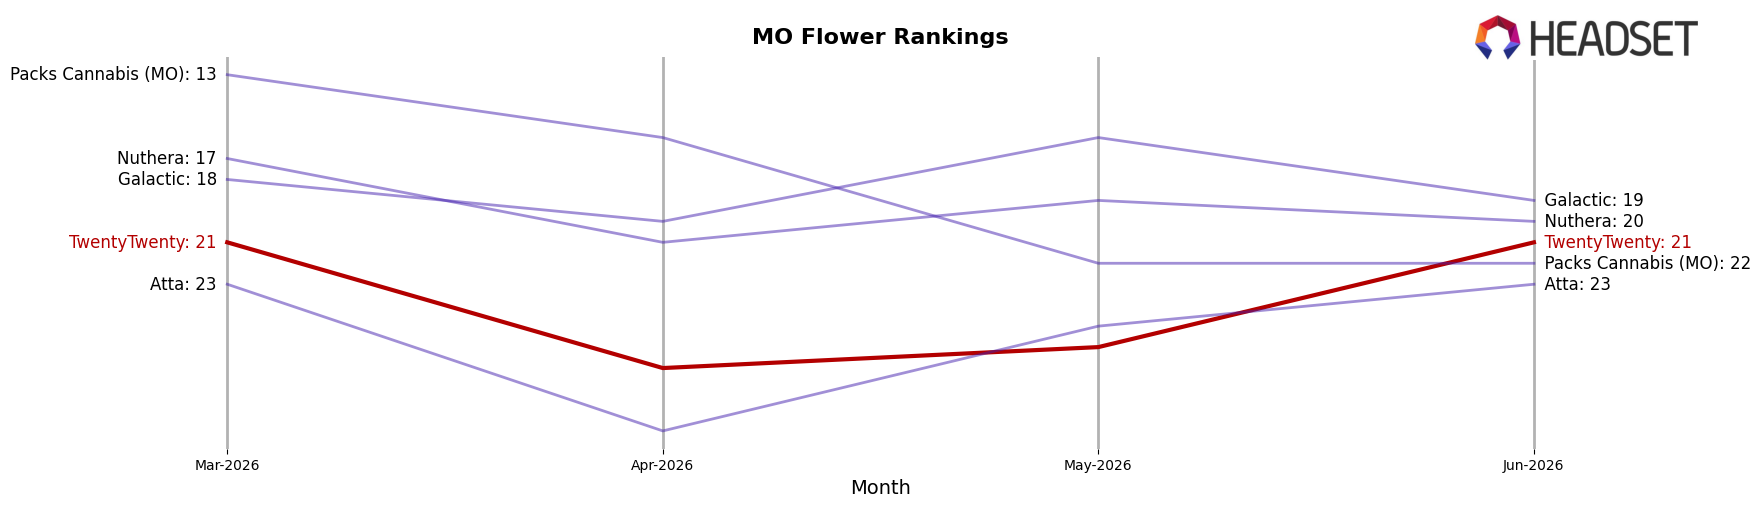
TwentyTwenty ranks #21 in MO Flower in June 2026, down 3 positions year over year from #18, while holding flat versus March 2026 at #21; this contrasts with Sinse Cannabis moving up 3 positions to #2 from #5 year over year and Amaze Cannabis climbing 2 positions to #4 from #6, even as category leader Flora Farms stayed at #1 amid a 5.1% year-over-year sales decline. With a prior peak at #13 in December 2025 and no improvement from March 2026, the pattern implies TwentyTwenty is stuck in the low-20s while faster-rising peers capture share momentum.
Notable Products
Hash Burger (3.5g) posted the steepest decline in June 2026 at -29.3% MoM while dropping to rank 6, and Hash Burger Ground (7g) also slipped -27.6% MoM at rank 9; in contrast, Color of Space Shake (7g) surged 55.3% MoM into rank 8. Hash Burger Shake (7g) held rank 1 despite an -8.1% MoM dip, and GMO S1 Pre-Roll (1g) climbed 26.9% MoM to rank 5. With seven of the top ten in Flower and multiple Shake formats inside the top 4, the mix points to a pivot toward value-oriented multi-serve packs even as single-strain Hash Burger formats cool.
Top Selling Cannabis Brands
Data for this report comes from real-time sales reporting by participating cannabis retailers via their point-of-sale systems, which are linked up with Headset’s business intelligence software. Headset’s data is very reliable, as it comes digitally direct from our partner retailers. However, the potential does exist for misreporting in the instance of duplicates, incorrectly classified products, inaccurate entry of products into point-of-sale systems, or even simple human error at the point of purchase. Thus, there is a slight margin of error to consider. Brands listed on this page are ranked in the top twenty within the market and product category by total retail sales volume.

