Jun-2026
Sales
Trend
6-Month
Product Count
SKUs
Avg Price
YoY Sales Change
YoY Price Change
Market Insights Snapshot
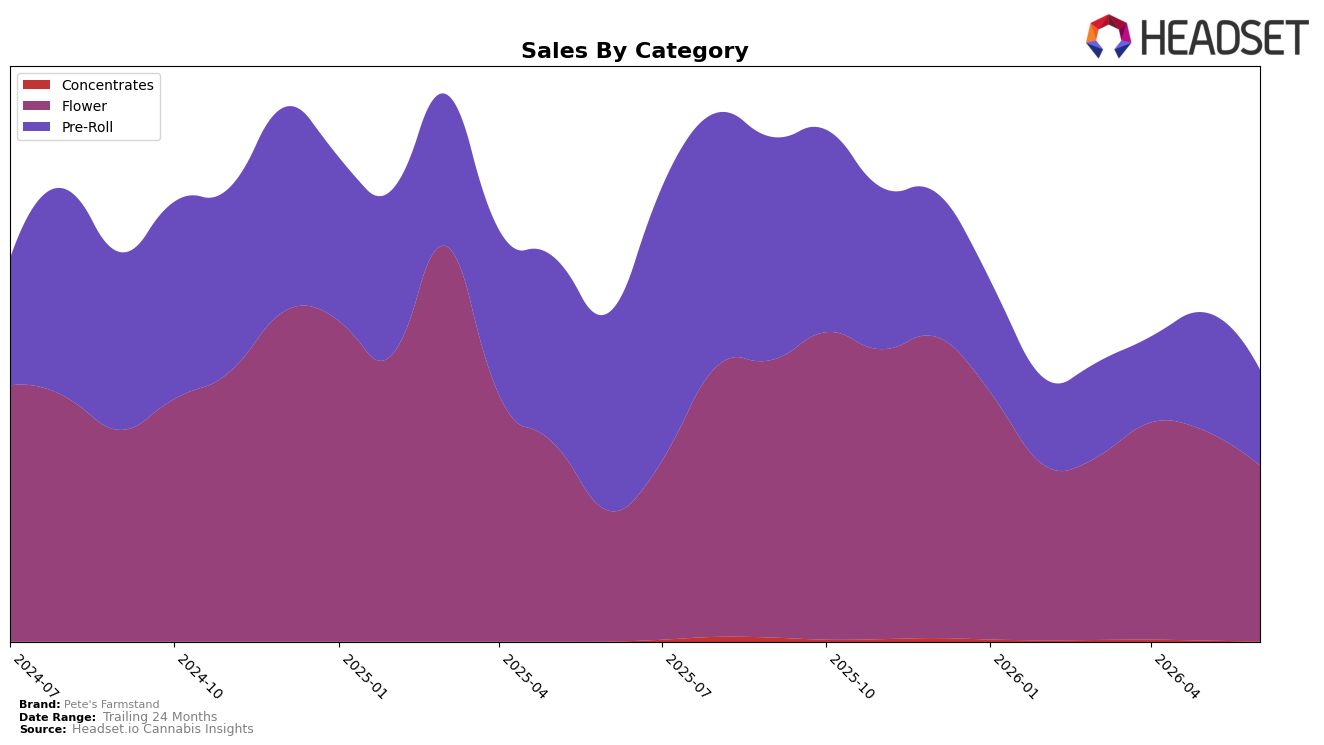
In June 2026, Pete's Farmstand concentrated 64.70% of sales in Flower with a 34.36% year-over-year increase but a 16.19% month-over-month decline, while Pre-Roll held 35.23% share with a 51.53% year-over-year contraction and an 18.88% month-over-month drop. Concentrates remained a rounding error at 0.07% share despite a 138.21% year-over-year spike, as month-over-month fell 82.90%. With overall brand sales down 17.27% year over year alongside a 27.33% average price increase, the mix shows a pivot toward higher-priced Flower even as sequential softness in both Flower and Pre-Roll weighed on June momentum; the implication is that reliance on Flower is intensifying while Pre-Roll erosion is becoming the primary drag.
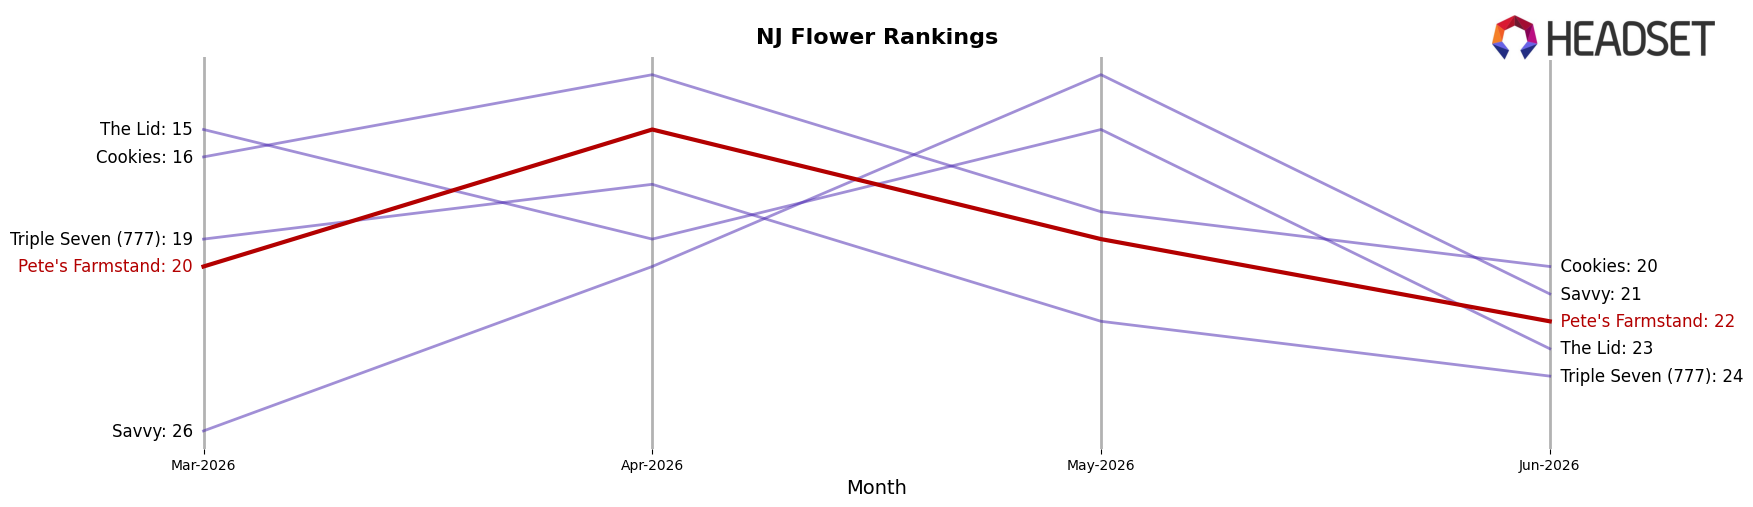
Holding rank 22 in Flower in New Jersey while Flower mix rose to 64.70% and Pre-Roll shrank to 35.23% positions Pete's Farmstand as a mid-pack Flower player whose pricing strategy (+27.33% average price year over year) may be trading volume for margin. The 16.19% month-over-month Flower dip paired with an 18.88% month-over-month Pre-Roll decline indicates that June weakness is not isolated to a single category, but the 34.36% year-over-year Flower lift against a 51.53% year-over-year Pre-Roll decline suggests future share gains depend on defending Flower rank while selectively pruning low-velocity Pre-Roll; the strategic takeaway is to lean into differentiated Flower where rank 22 provides headroom and to confine Concentrates to opportunistic trials rather than core mix expansion.
Competitive Landscape
Pete's Farmstand is ranked #22 in New Jersey Flower in June 2026, a 2-position improvement from #24 year over year, but down 2 spots from #20 three months ago; against this, Find. climbed from #12 to #1 with 225.99% YoY sales growth while Ozone held #2 despite a 10.61% YoY sales decline, indicating that category share is consolidating at the top as mid-tier brands like Pete's Farmstand oscillate within a narrow band between ranks #20 and #24 after peaking at #7 in March 2025, a trajectory that implies stabilization rather than a return to prior peak without a step-change in velocity.
Notable Products
Redeye Jedi Pre-Roll (1g) posted the steepest movement in June 2026 with a -67.5% month-over-month decline and slid to rank 7, while Blues Qlues Pre-Roll (1g) surged +51.6% and rose to rank 2; this divergence implies volatility within the same format. Princess Cut Pre-Roll (1g) held rank 1 with no reported month-over-month change and anchored the lineup as Frozen Margarita Pre-Roll (1g) dipped -3.9% at rank 4, and five of the top five were Pre-Roll SKUs, with all top ten also concentrated in Pre-Roll. Despite one standout gain and a severe drop, the rank distribution clusters at the top five with small negative and low positive shifts elsewhere, pointing to a category that is saturated but still capable of rapid share swings inside Pete's Farmstand. The product mix signals a Pre-Roll-centric strategy where a few flagship SKUs set the ceiling and tactical rotation can reallocate demand rather than expand it.
Top Selling Cannabis Brands
Data for this report comes from real-time sales reporting by participating cannabis retailers via their point-of-sale systems, which are linked up with Headset’s business intelligence software. Headset’s data is very reliable, as it comes digitally direct from our partner retailers. However, the potential does exist for misreporting in the instance of duplicates, incorrectly classified products, inaccurate entry of products into point-of-sale systems, or even simple human error at the point of purchase. Thus, there is a slight margin of error to consider. Brands listed on this page are ranked in the top twenty within the market and product category by total retail sales volume.

