Jun-2026
Sales
Trend
6-Month
Product Count
SKUs
Avg Price
YoY Sales Change
YoY Price Change
Market Insights Snapshot
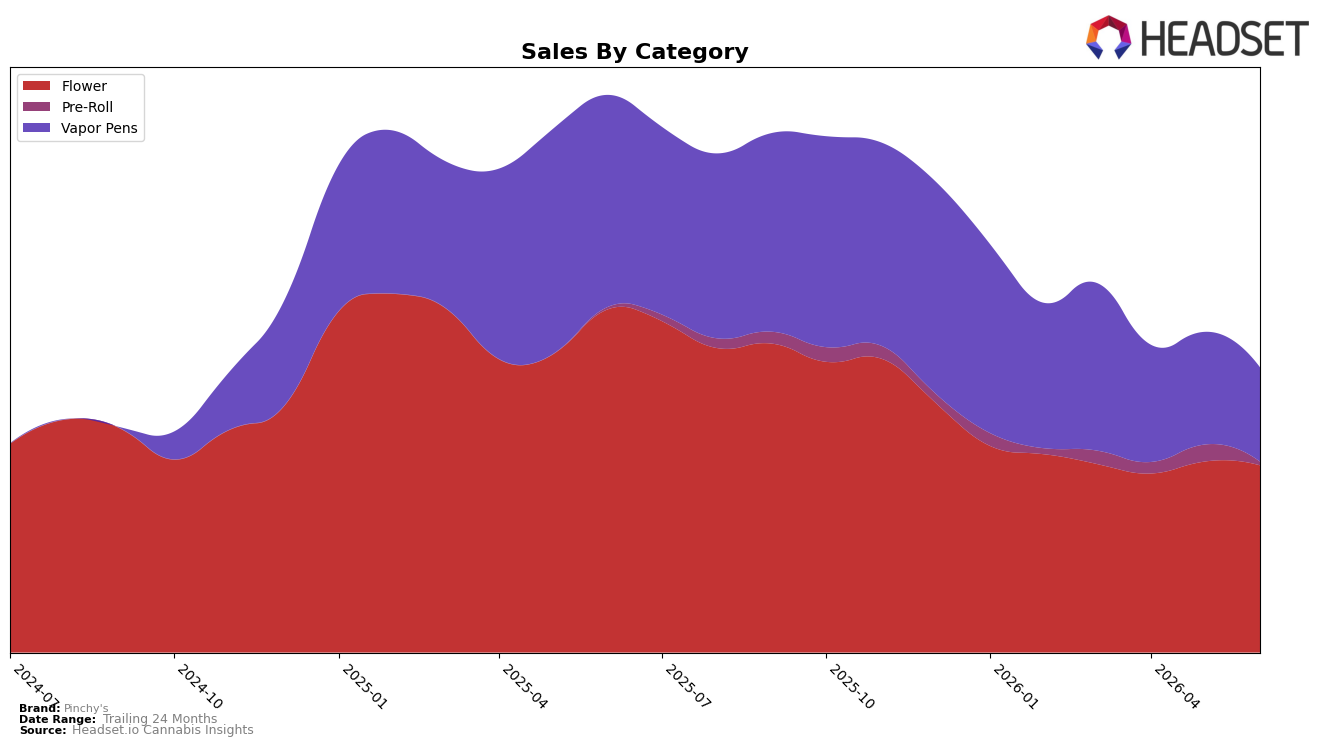
In June 2026, Pinchy's concentrated 65.74% of sales in Flower with a year-over-year decline of 45.52% and a month-over-month dip of 1.99%, while Vapor Pens held 33.07% share with a steeper year-over-year drop of 55.55% and a sharper month-over-month slide of 16.32%; Pre-Roll represented 1.19% share with a 59.90% year-over-year increase but a 79.76% month-over-month retreat. Against a brand-level year-over-year sales change of -48.93% and an average price down 1.24%, the category tilt toward Flower alongside heavier contraction in Vapor Pens suggests the mix is cushioning volatility month to month but dragging year over year, implying Pinchy's volume is tethered to Flower’s stabilization and vulnerable to Vapor Pens’ faster erosion.
With Flower anchoring rank position 30 in Missouri and holding two-thirds of the mix at 65.74% while contracting 45.52% year over year versus Vapor Pens’ 55.55%, the relative outperformance of Flower combined with a milder 1.99% month-over-month decline signals that defending shelf space and price architecture in Flower can slow aggregate decline more effectively than chasing share in Vapor Pens, where a 16.32% month-over-month pullback undermines recovery. The surge-and-crash pattern in Pre-Roll—59.90% year-over-year growth alongside a 79.76% month-over-month drop—indicates promotion- or drop-driven bursts that are too small at 1.19% share to offset core-category contraction, implying that June 2026 positioning hinges on stabilizing Flower velocity and selectively pruning Vapor Pens SKUs to reduce mix drag.
Competitive Landscape
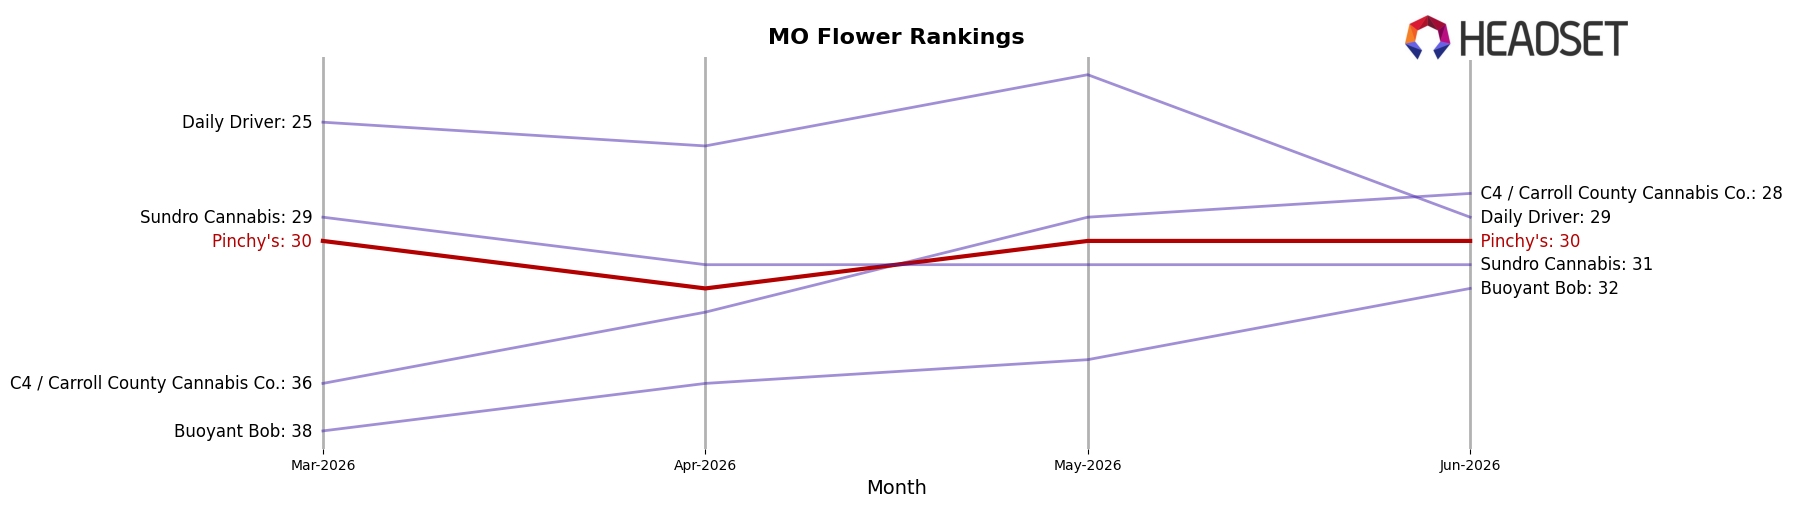
Pinchy's sits at rank #30 in Missouri Flower in June 2026, down 13 positions year over year from #17, and flat versus March 2026 at #30, while category peak rank #14 in February 2025 underscores a 16-place slide from its best point; in contrast, Flora Farms held #1 with a -5.1% YoY sales change and Sinse Cannabis advanced to #2 with a +33.2% YoY sales increase, indicating that Pinchy's share position is weakening relative to leaders despite some top-tier softness. This trajectory implies Pinchy's is ceding rank to faster-rising competitors and will need a catalyst to reverse the multi-period stagnation at #30 and the YoY drop from #17.
Notable Products
Studio 54 Pre-Roll (1g) posted the steepest decline in June 2026, dropping 70.9% month over month and sliding to rank 2, while Orange 43 (3.5g) fell 17.0% but held rank 1. OG Kush Distillate Cartridge (1g) decreased 24.0% to rank 4 as Grandaddy Purple Distillate Full Spectrum Cartridge (1g) fell 27.5% to rank 5, whereas Bacio Gelato Distillate Cartridge (1g) inched up 1.3% to rank 3. Vapor Pens occupy six of the top ten spots, yet their mixed MoM results and the $37,320 concentrated in Orange 43 (3.5g) indicate reliance on a single Flower anchor amid a volatile pen lineup. The pattern implies Pinchy's is leaning on flagship Flower to sustain rank while rebalancing away from underperforming Pre-Rolls and selectively defending only the most resilient Vapor Pen SKUs.
Top Selling Cannabis Brands
Data for this report comes from real-time sales reporting by participating cannabis retailers via their point-of-sale systems, which are linked up with Headset’s business intelligence software. Headset’s data is very reliable, as it comes digitally direct from our partner retailers. However, the potential does exist for misreporting in the instance of duplicates, incorrectly classified products, inaccurate entry of products into point-of-sale systems, or even simple human error at the point of purchase. Thus, there is a slight margin of error to consider. Brands listed on this page are ranked in the top twenty within the market and product category by total retail sales volume.

