May-2026
Sales
Trend
6-Month
Product Count
SKUs
Avg Price
YoY Sales Change
YoY Price Change
Market Insights Snapshot
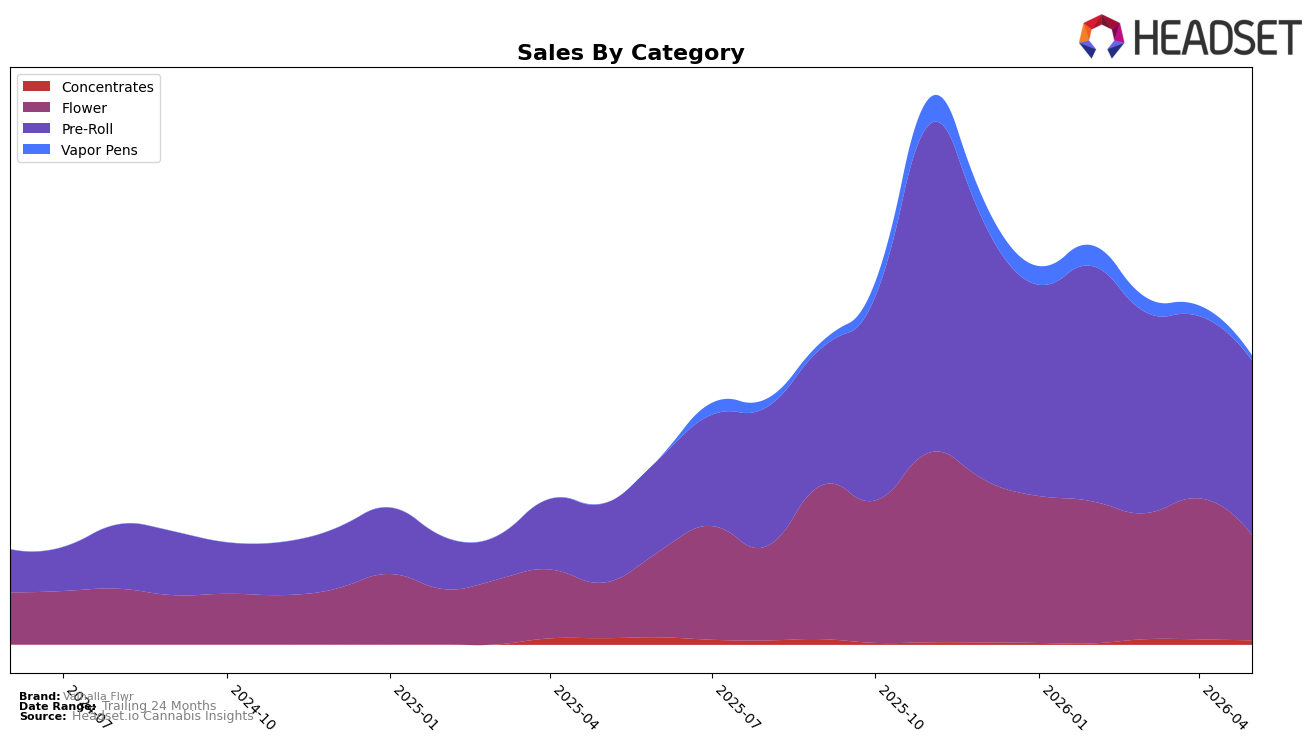
In May 2026, Valhalla Flwr leaned further into Pre-Roll, which held 60.45% share with 121.28% year-over-year growth but a 4.27% month-over-month dip, while Flower sat at 36.39% share with 89.93% year-over-year growth and a 25.39% month-over-month decline; Vapor Pens and Concentrates were marginal at 1.70% and 1.46% share, with month-over-month drops of 52.54% and 19.39% respectively. Average price for the brand was up 1.95% year-over-year to $29.92, while category price points diverged (Pre-Roll at 21.97 and Flower at 71.67), and the brand ranked 15 in Pre-Roll in British Columbia. The pattern implies a consolidation around value-leaning Pre-Rolls as the primary growth engine, with a tactical retrenchment in Flower and rapid pullback in minor formats to preserve mix efficiency.
The steep 25.39% month-over-month decline in Flower alongside a 4.27% month-over-month dip in Pre-Roll, despite 89.93% and 121.28% year-over-year gains respectively, indicates a deliberate shift toward defending high-velocity packs over premium ounce equivalents, reinforcing price-led acquisition as average price rose only 1.95% year-over-year. With Vapor Pens down 52.54% month-over-month and Concentrates down 19.39% month-over-month at sub-2% shares, the portfolio is deprioritizing experimentation in fringe formats while maintaining a foothold at rank 15 in Pre-Roll in British Columbia. This mix signals positioning as a Pre-Roll-first player targeting basket frequency and shelf breadth, while Flower becomes supportive rather than lead, which should guide merchandising toward multipack and value tiers to stabilize month-over-month volatility.
Competitive Landscape
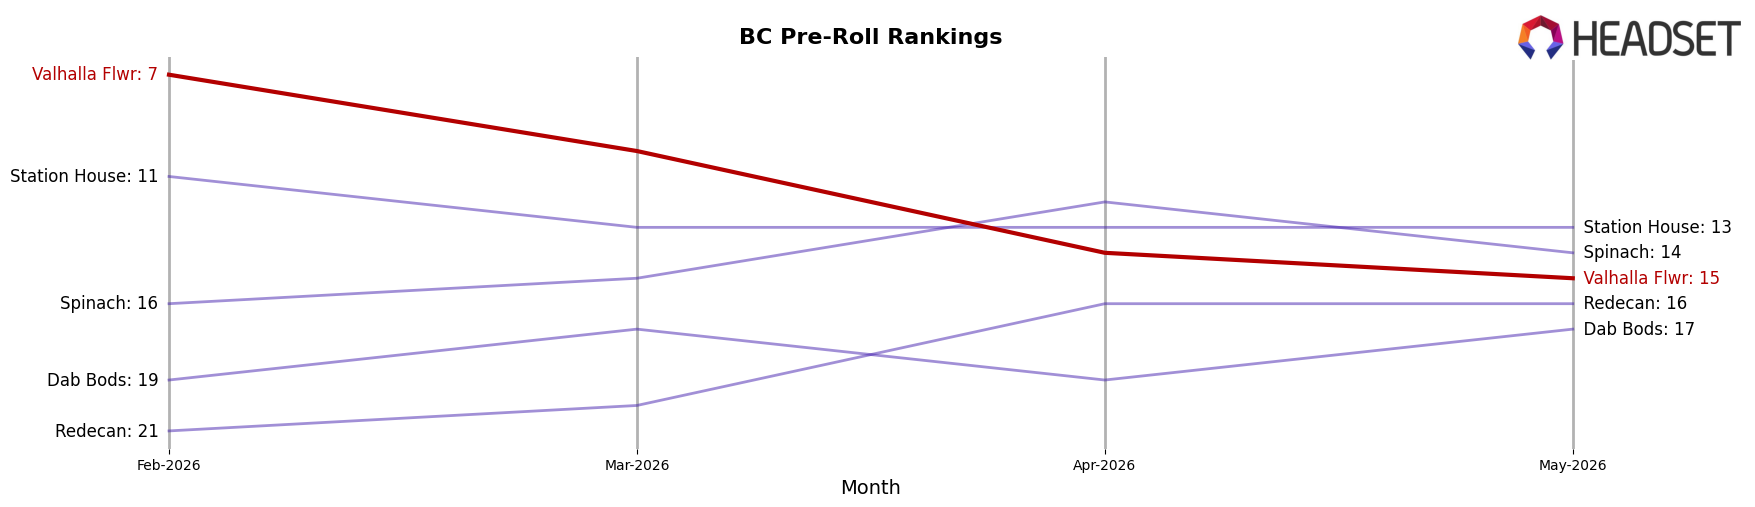
Valhalla Flwr sits at rank #15 in May 2026, improving 7 positions from a year-ago rank of #22 while falling 8 spots from February 2026’s #7, indicating a recovery versus last year but a pullback versus recent momentum; by contrast, General Admission held #1 year-over-year at #1, and BC Doobies climbed from #7 to #2 alongside a 111.5% YoY sales gain, outpacing Valhalla Flwr’s trajectory. With a historical peak of #1 in October 2025 and a current position of #15, the pattern implies brand equity exists to re-enter the top 10, but near-term share is being redistributed toward faster risers, so the rank path points to a mid-pack reset unless recent declines reverse.
Notable Products
The steepest decline came from Twisted Trio Variety Pack Pre-Roll 3-Pack (1.5g), down 27.24% month over month and sitting at rank 7, while Cosmic Cherry Diamond Infused Pre-Roll 3-Pack (1.5g) dropped 26.23% at rank 10. At the top, Rainbow Lava Pre-Roll 3-Pack (1.5g) rose 14.22% to hold rank 1 against Pebble Punch Pre-Roll 3-Pack (1.5g) sliding 10.83% at rank 2. With all ten top products in May 2026 concentrated in Pre-Roll formats and two multi-pack 10-Pack entries debuting without month-over-month baselines, the mix tilts toward assortment breadth within Pre-Rolls rather than new category expansion, implying Valhalla Flwr is prioritizing depth and price-tier experiments inside its flagship format.
Top Selling Cannabis Brands
Data for this report comes from real-time sales reporting by participating cannabis retailers via their point-of-sale systems, which are linked up with Headset’s business intelligence software. Headset’s data is very reliable, as it comes digitally direct from our partner retailers. However, the potential does exist for misreporting in the instance of duplicates, incorrectly classified products, inaccurate entry of products into point-of-sale systems, or even simple human error at the point of purchase. Thus, there is a slight margin of error to consider. Brands listed on this page are ranked in the top twenty within the market and product category by total retail sales volume.

