.svg)

Sep-2026
Sales
Trend
6-Month
Product Count
SKUs
Avg Price
YoY Sales Change
YoY Price Change


Where to Buy
Polaris MMJ is stocked at 63 licensed dispensaries across Nevada and Oregon, 61 of them in Nevada, with the deepest coverage in Las Vegas, Henderson, Reno, North Las Vegas, and Carson City. Search by ZIP code or city below to find the closest one, or filter by product type if you are after a specific format.
Market Insights Snapshot
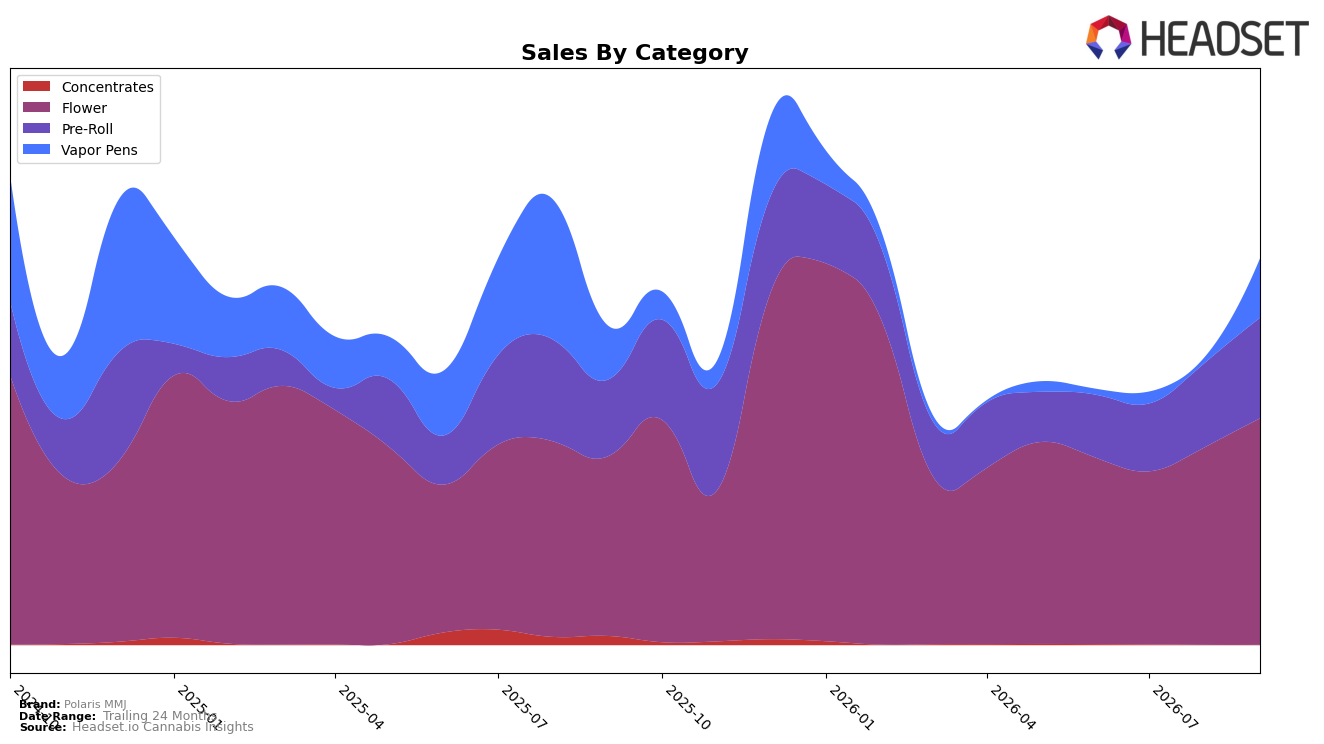
Category mix in September 2026 tilted further toward Flower at 58.69% share with year-over-year growth of 26.02% and month-over-month growth of 14.73%, while Pre-Roll held 26.01% share with 31.40% YoY and 19.37% MoM growth; Vapor Pens expanded to 15.30% share with 10.51% YoY and an outsized 952.91% MoM surge. Despite brand-level average price declining 9.20% YoY to $15.37, category-level pricing skewed higher in Vapor Pens at $40.84 and Flower at $25.54, contrasting with Pre-Roll at $6.78; coupled with a state-category placement at rank 20 in Flower in Nevada, the pattern indicates Polaris MMJ is leaning into unit velocity in lower-price segments while using a rapidly scaling Vapor Pen presence to widen basket mix.
The mix shift—Flower up 14.73% MoM and Pre-Roll up 19.37% MoM alongside a 952.91% MoM spike in Vapor Pens—implies Polaris MMJ is recalibrating toward breadth across inhalables to offset price compression of 9.20% YoY, with Flower’s 26.02% YoY lift anchoring share defense at rank 20 in Nevada. With Pre-Roll contributing over a quarter of sales at entry-level price points and Vapor Pens adding a premium ticket, the brand is positioning for blended-margin stability and cross-trial, suggesting future share gains will depend on converting the recent Vapor Pen momentum into sustained repeat while maintaining Flower’s 58.69% share as the base.
Competitive Landscape
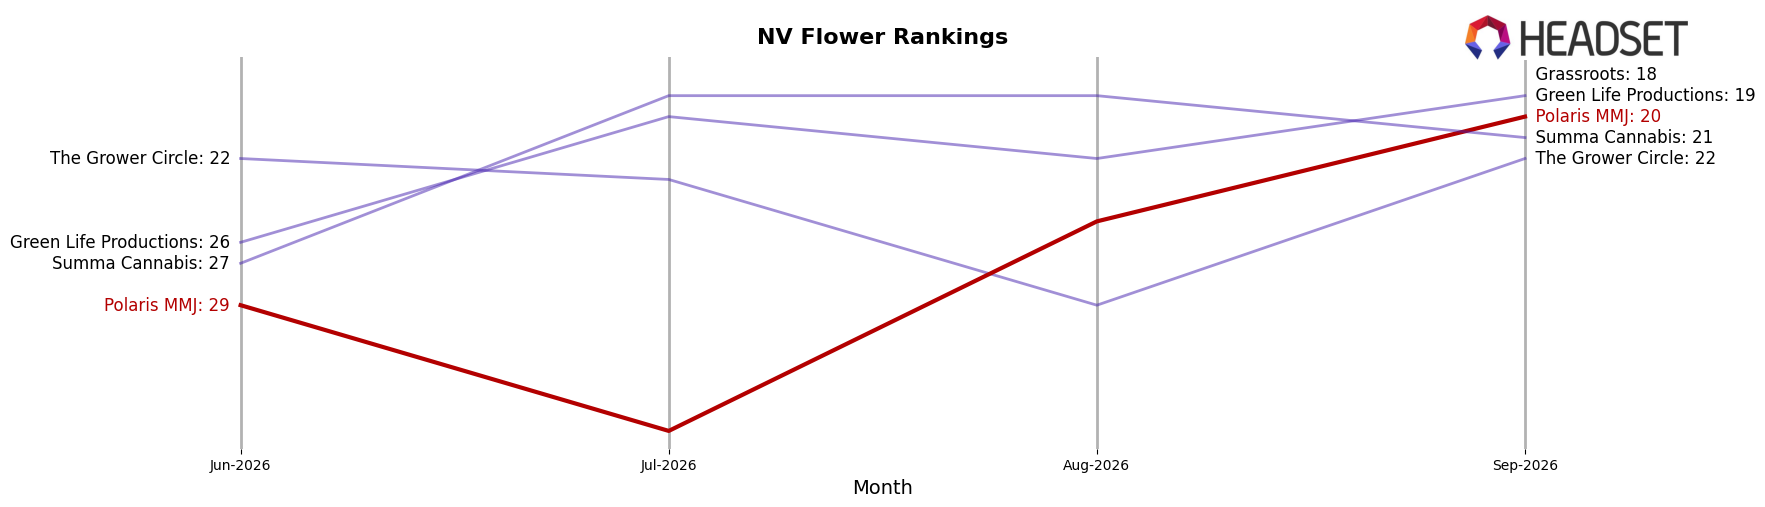
Polaris MMJ sits at rank #20 in NV Flower for September 2026, improving 10 positions year over year from #30, and also moving up 9 spots from #29 in June 2026, while still trailing its peak rank of #17 from February 2026; by contrast, RYTHM held #1 both year over year and in September 2026, and Alternative Medicine Association / AMA advanced from #5 to #3 with 32.6% year-over-year sales growth. With Neon Moon jumping from #9 to #4 alongside 82.7% year-over-year growth while Polaris MMJ’s best month remained February 2026 at #17, the pattern implies Polaris MMJ is recovering rank but ceding momentum to faster-climbing competitors, pointing to share stabilization rather than breakout gains.
Notable Products
NY Sour Diesel Pre-Roll (1g) delivered the standout move in September 2026 with a 126% month-over-month surge into rank 3, while Head Cheese Pre-Roll (1g) slipped 13% yet still held rank 1. Jenny Kush Pre-Roll (1g) fell 52% to rank 5 as Head Cheese (3.5g) declined 10% to rank 2, indicating volatility concentrated at the top two ranks. With seven of the top ten positioned in Pre-Roll, the mix skews toward ready-to-smoke formats, implying Polaris MMJ is leaning into quicker-turn SKUs even as flagship Flower softens.
Top Selling Cannabis Brands






Data for this report comes from real-time sales reporting by participating cannabis retailers via their point-of-sale systems, which are linked up with Headset’s business intelligence software. Headset’s data is very reliable, as it comes digitally direct from our partner retailers. However, the potential does exist for misreporting in the instance of duplicates, incorrectly classified products, inaccurate entry of products into point-of-sale systems, or even simple human error at the point of purchase. Thus, there is a slight margin of error to consider. Brands listed on this page are ranked in the top twenty within the market and product category by total retail sales volume.

