Oct-2025
Sales
Trend
6-Month
Product Count
SKUs
Avg Price
YoY Sales Change
YoY Price Change
Market Insights Snapshot
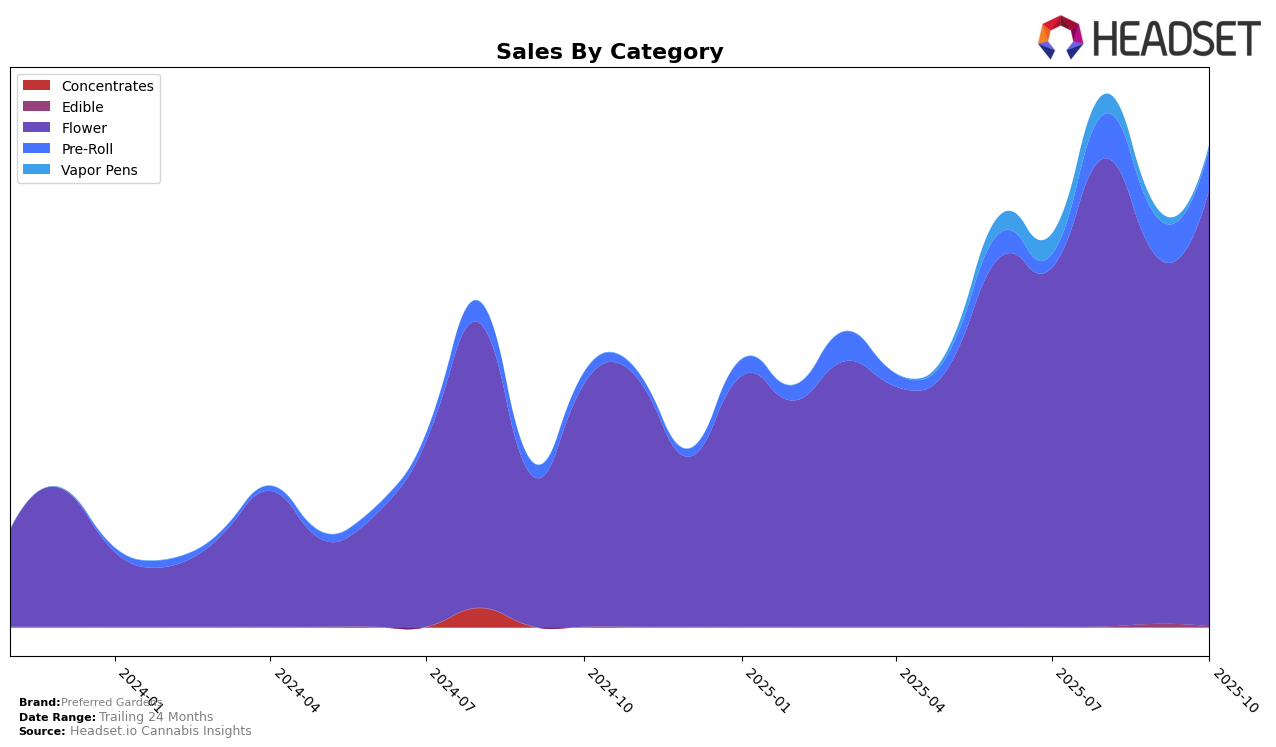
Preferred Gardens has displayed varied performance across different states and categories, with notable shifts in rankings over recent months. In California, the Flower category saw an impressive climb from the 78th position in July to 43rd by October, indicating a strong upward trajectory in this competitive market. However, in Arizona, the brand remained outside the top 30, maintaining a consistent rank around the mid-40s, which suggests room for growth. Interestingly, New York presented a fluctuating pattern, with rankings dipping to 32nd in September but recovering to 29th in October, showcasing resilience in a market that appears to be more volatile.
Across these states, Preferred Gardens' sales figures reveal some intriguing trends. For instance, while the brand did not breach the top 30 in Arizona, it recorded a steady increase in sales from September to October, indicating potential consumer interest that has not yet translated into higher rankings. In California, the significant rise in sales from July to October aligns with its improved ranking, suggesting successful market penetration strategies. Meanwhile, New York's sales dipped in September but rebounded in October, mirroring its ranking recovery and hinting at possible external factors influencing consumer behavior. Overall, Preferred Gardens is showing promising signs of growth, particularly in California, while facing challenges and opportunities in other states.
Competitive Landscape
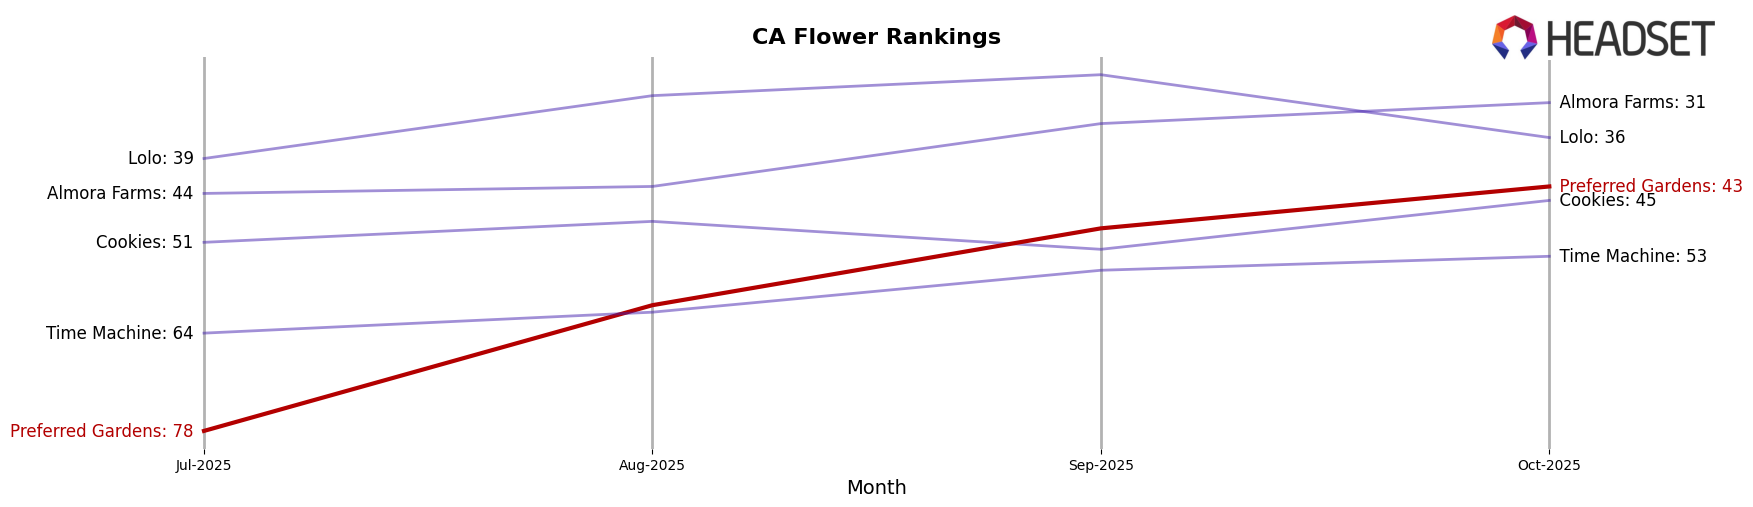
In the competitive California flower market, Preferred Gardens has shown a notable upward trajectory in rankings from July to October 2025, moving from 78th to 43rd place. This improvement is significant when compared to competitors such as Cookies, which fluctuated around the 45th to 52nd range, and Time Machine, which remained relatively stable between 53rd and 64th. The sales growth of Preferred Gardens is also noteworthy, with a consistent increase each month, culminating in a substantial rise by October. This contrasts with Lolo, which experienced a decline in rank from 27th to 36th, despite having higher sales figures. Meanwhile, Almora Farms improved its rank to 31st, indicating a competitive edge but still trailing behind Preferred Gardens' rapid ascent. These dynamics suggest that Preferred Gardens is gaining traction and market share, potentially due to strategic marketing or product differentiation, positioning it as a rising contender in the California flower category.
Notable Products
In October 2025, Crash Out (3.5g) emerged as the top-performing product for Preferred Gardens, climbing from second place in September to first, with notable sales figures of 2,511 units. Lemon Tree Pre-Roll (1g) dropped from its consistent first place in August and September to second place in October, indicating a shift in consumer preference. Orange Dream Pre-Roll (1g) maintained a steady third-place ranking from September to October, showcasing stable demand. New entries like Gorilla Glue #4 (3.5g) and Cherry Stomper (3.5g) entered the rankings in October, securing fourth and fifth places, respectively. This shift in rankings suggests a dynamic market with changing consumer tastes in Preferred Gardens' product lineup.
Top Selling Cannabis Brands
Data for this report comes from real-time sales reporting by participating cannabis retailers via their point-of-sale systems, which are linked up with Headset’s business intelligence software. Headset’s data is very reliable, as it comes digitally direct from our partner retailers. However, the potential does exist for misreporting in the instance of duplicates, incorrectly classified products, inaccurate entry of products into point-of-sale systems, or even simple human error at the point of purchase. Thus, there is a slight margin of error to consider. Brands listed on this page are ranked in the top twenty within the market and product category by total retail sales volume.

