.svg)

Aug-2026
Sales
Trend
6-Month
Product Count
SKUs
Avg Price
YoY Sales Change
YoY Price Change


Where to Buy
Lolo is stocked at 247 licensed dispensaries across California and Washington, 243 of them in California, with the deepest coverage in Los Angeles, San Diego, San Francisco, Long Beach, and Sacramento. Search by ZIP code or city below to find the closest one, or filter by product type if you are after a specific format.
Market Insights Snapshot
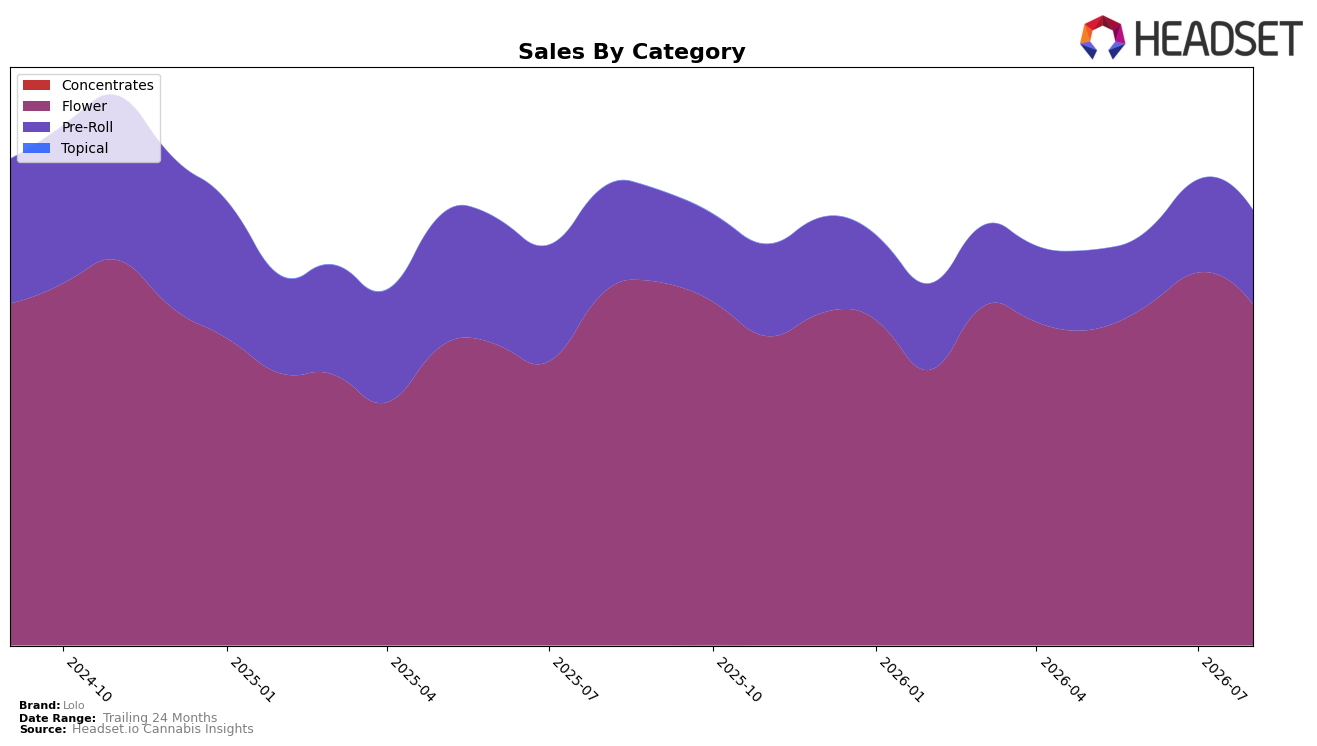
Lolo’s category mix in August 2026 tilted further toward Flower at 78.33% share while Pre-Roll held 21.67% share, with Flower down 3.65% year over year and 8.73% month over month, and Pre-Roll down 10.42% year over year but up 1.42% month over month. Despite a 13.91% year-over-year rise in average price and a brand-level sales change of -5.24% year over year, the heavier exposure to Flower intensified short-term drag, while the modest Pre-Roll month-over-month uptick provided only partial offset; the pattern implies that August 2026 mix concentration amplified downside during a Flower-specific dip.
Positionally, a 34 rank in Flower within California means Lolo’s reliance on a category with a month-over-month decline of 8.73% likely constrained visibility versus peers leaning into steadier segments, while Pre-Roll’s 1.42% month-over-month gain offered a small counterweight. With a 24-month sales change of -28.58% against a mix still 78.33% in Flower and average price up 13.91% year over year, the configuration suggests pricing power without sufficient volume resilience; the implication is that Lolo’s positioning would benefit from tempering Flower concentration in favor of segments showing near-term momentum.
Competitive Landscape
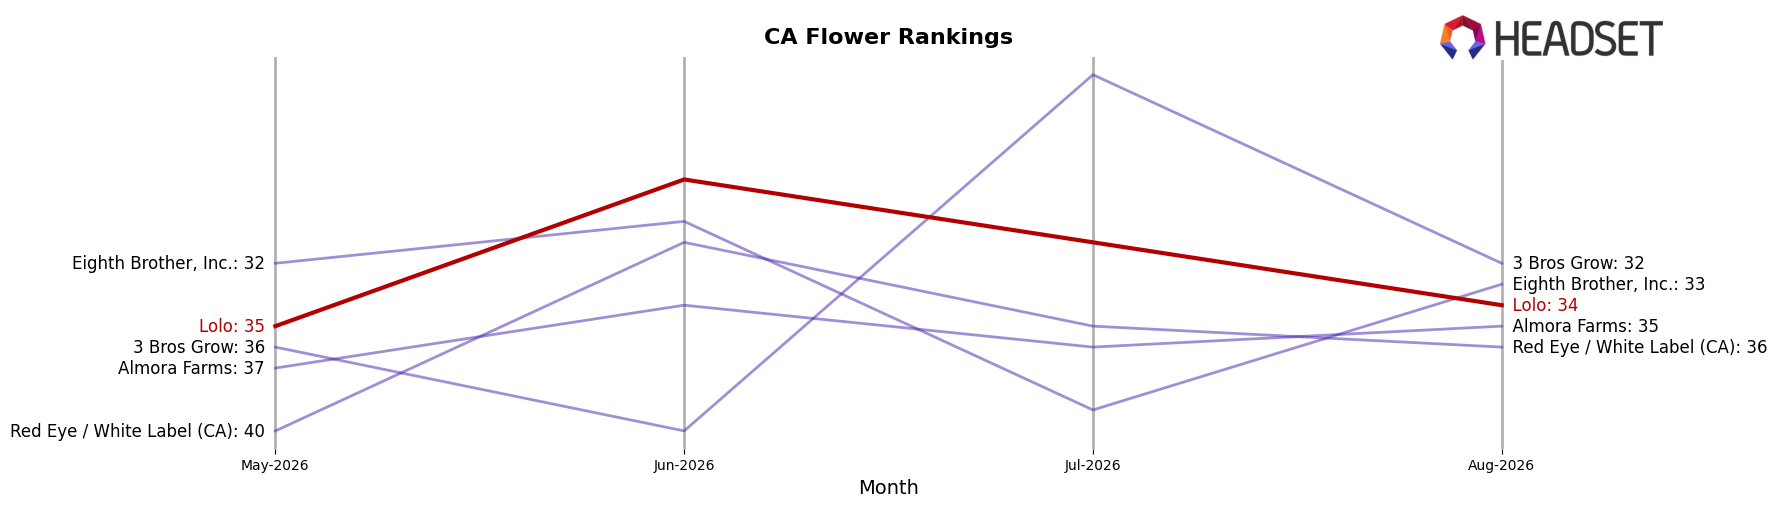
Lolo sits at rank #34 in California Flower for August 2026, slipping 4 positions YoY from #30 while improving 1 spot from #35 over the last three months; against this, STIIIZY rose from #2 to #1 with 50.99% YoY sales growth and Oakfruitland jumped from #14 to #5 with an 80.47% YoY lift, whereas CannaBiotix (CBX) fell from #1 to #3 alongside a -15.42% YoY sales change; relative to its peak at #26 in September 2025, the current #34 rank and 8-position drop from that peak indicate Lolo’s trajectory is flattening into a lower mid-tier position despite a recent 1-rank quarter-on-quarter uptick.
Notable Products
Holy Grail OG Smalls (3.5g) posted the steepest move in August 2026 with a -18.9% month-over-month drop while holding rank 3, and Sour Diesel Pre-Roll (1g) fell -44.1% to rank 7; together these declines contrast with Blueberry Scone Pre-Roll (1g), which rose +30.7% at rank 1. Two SKUs share rank 1, indicating split leadership: Blueberry Scone Pre-Roll (1g) up +30.7% versus OG Chem Pre-Roll (1g) down -33.3%, a divergence that points to shifting preference within the leading spot. With five of the top ten in the Pre-Roll family and only Peanut Butter Cake (3.5g) showing a modest +5.6% at rank 8 among Flowers, the mix implies Lolo is leaning into Pre-Rolls but must refresh underperforming classic strains to stabilize rank distribution.
Top Selling Cannabis Brands






Data for this report comes from real-time sales reporting by participating cannabis retailers via their point-of-sale systems, which are linked up with Headset’s business intelligence software. Headset’s data is very reliable, as it comes digitally direct from our partner retailers. However, the potential does exist for misreporting in the instance of duplicates, incorrectly classified products, inaccurate entry of products into point-of-sale systems, or even simple human error at the point of purchase. Thus, there is a slight margin of error to consider. Brands listed on this page are ranked in the top twenty within the market and product category by total retail sales volume.

