Market Insights Snapshot
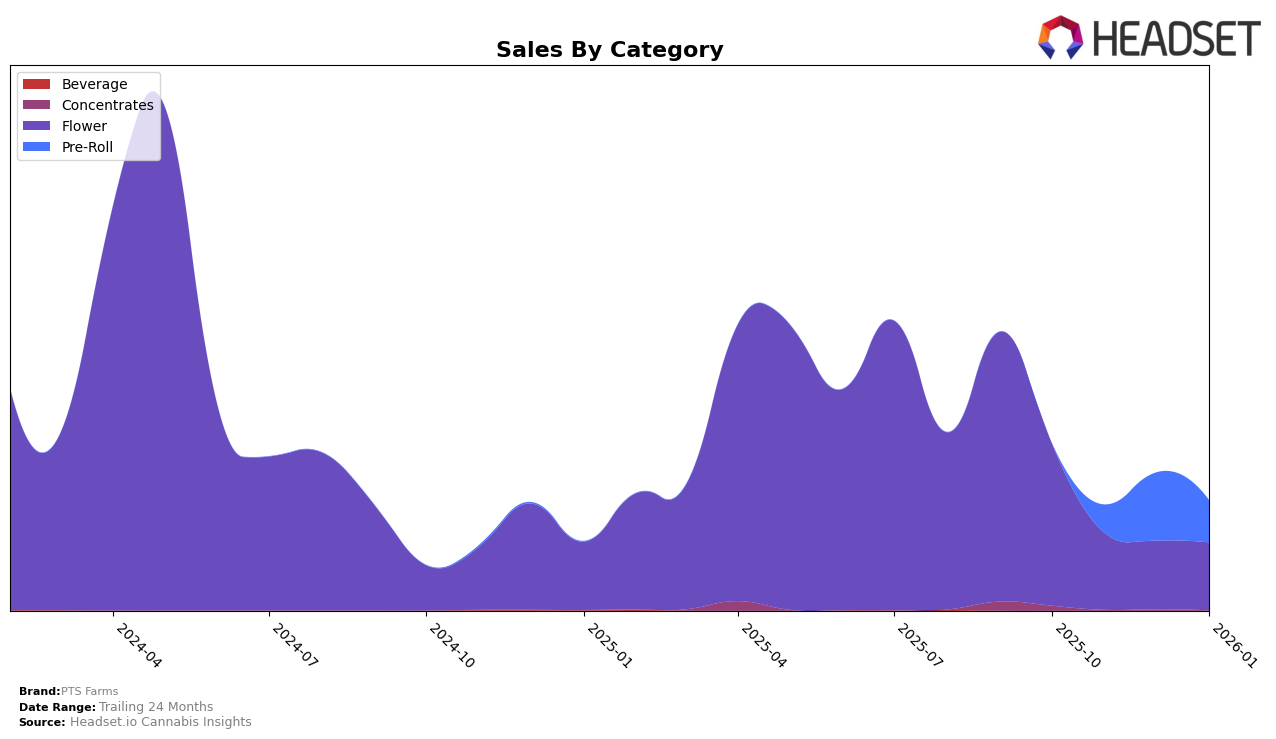
PTS Farms has shown varying performance across different categories and states, with notable fluctuations in their rankings. In the Ohio market, their Flower category has consistently ranked at 60th position from November 2025 to January 2026, indicating a stable yet challenging position in the market. This stability, however, is not necessarily favorable, as it suggests that PTS Farms has not broken into the top 30 brands, which could be a potential area for improvement. Despite this, the Flower category's sales have seen a significant drop from October to November 2025, declining from $81,498 to $38,327, and continued to decrease slightly through January 2026. This trend may reflect market saturation or increased competition in the Flower category within the state.
In contrast, the Pre-Roll category for PTS Farms in Ohio has shown more dynamic movement. Starting from a non-ranking position in October 2025, PTS Farms emerged to rank 31st in November 2025 and improved to 28th in December 2025, before slightly dropping back to 30th in January 2026. This upward movement, despite the minor setback in January, indicates a growing presence and potentially increasing demand for their Pre-Roll products. The sales figures support this positive trend, with a notable increase from $14,132 in November 2025 to $34,047 in December 2025, before settling at $20,875 in January 2026. This suggests that while PTS Farms is making strides in the Pre-Roll category, maintaining momentum will be crucial to further capitalize on this growth trajectory.
Competitive Landscape
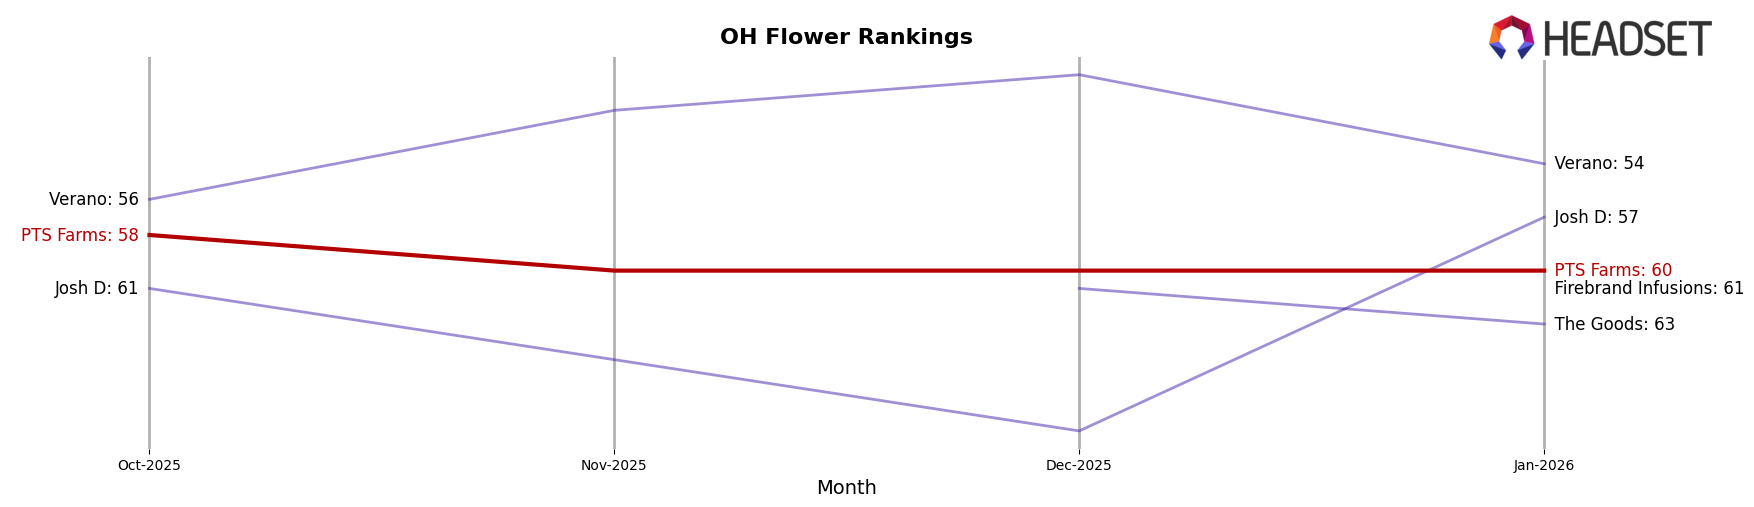
In the competitive landscape of the Ohio flower category, PTS Farms has maintained a consistent rank of 60 from November 2025 through January 2026, despite fluctuations in sales. This steadiness in rank contrasts with competitors like Verano, which experienced a drop from 49 to 54, and Josh D, which saw a significant rebound from 69 to 57. Meanwhile, The Goods and Firebrand Infusions have not been in the top 20 for most months, indicating a challenging market position. Despite a notable decline in sales from October to January, PTS Farms' ability to maintain its rank suggests resilience and potential for strategic growth, especially when competitors are experiencing more volatility in their rankings.
Notable Products
In January 2026, the top-performing product for PTS Farms was Apple Fritter Pre-Roll (1g) in the Pre-Roll category, which climbed to the number one spot with sales reaching 1165 units. Garlic OG Pre-Roll (1g) made a significant leap to secure the second position, up from third place in December, with a notable increase in sales. Alien Pebbles Pre-Roll (1g) experienced a decline, dropping to third place from its previous first place ranking in December. Meanwhile, Apple Fritter (14.15g) consistently maintained its fourth position across the months. Apple Fritter (2.83g) remained in fifth place, showing stability in its ranking despite minor fluctuations in sales figures.
Top Selling Cannabis Brands
Data for this report comes from real-time sales reporting by participating cannabis retailers via their point-of-sale systems, which are linked up with Headset’s business intelligence software. Headset’s data is very reliable, as it comes digitally direct from our partner retailers. However, the potential does exist for misreporting in the instance of duplicates, incorrectly classified products, inaccurate entry of products into point-of-sale systems, or even simple human error at the point of purchase. Thus, there is a slight margin of error to consider. Brands listed on this page are ranked in the top twenty within the market and product category by total retail sales volume.

