.svg)

Aug-2026
Sales
Trend
6-Month
Product Count
SKUs
Avg Price
YoY Sales Change
YoY Price Change


Where to Buy
Ancient Roots is stocked at 49 licensed dispensaries across Ohio, with the deepest coverage in Columbus, Cincinnati, Ashtabula, Athens, and Aberdeen. Search by ZIP code or city below to find the closest one, or filter by product type if you are after a specific format.
Market Insights Snapshot
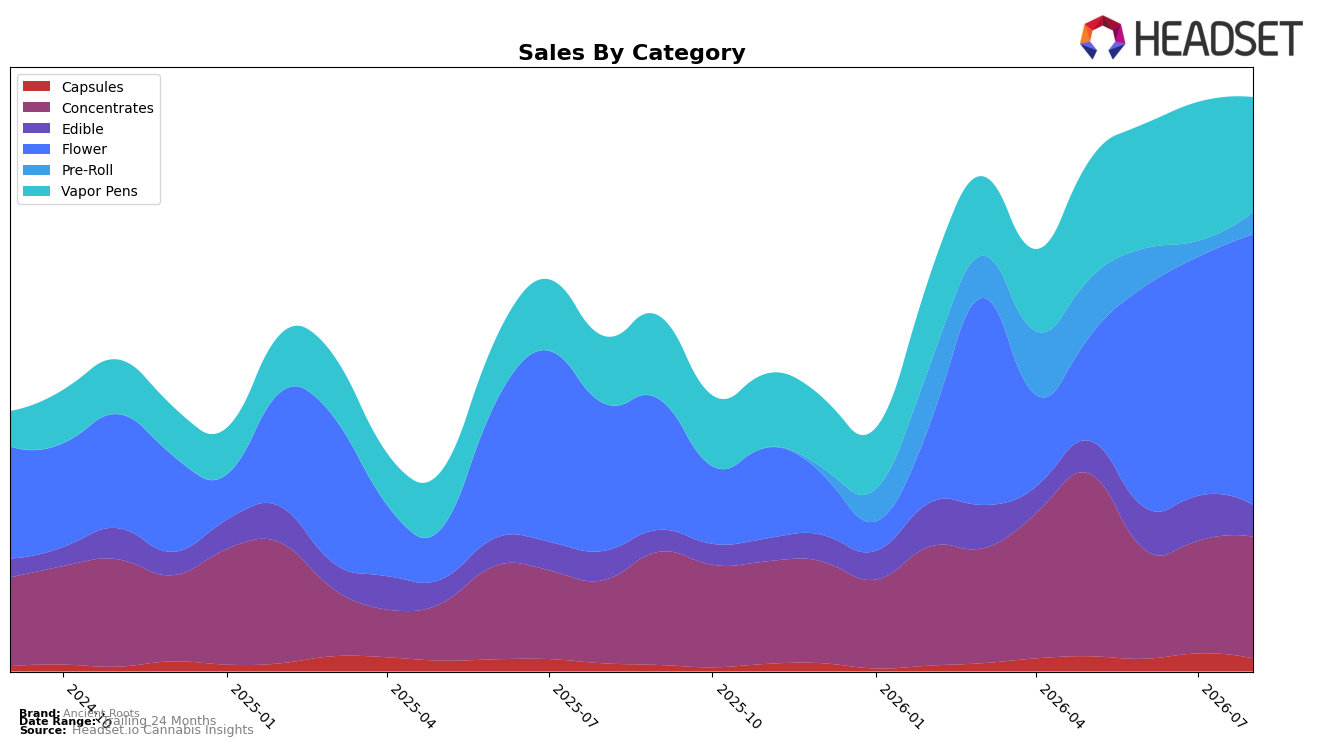
In August 2026, Ancient Roots concentrated nearly half of sales in Flower at 47.22% share while Vapor Pens held 20.03%, indicating a two-tier mix anchored by Flower growth and pen volatility. Flower expanded 83.99% year over year with a 13.30% month-over-month lift, while Vapor Pens rose 71.24% year over year but fell 17.23% month over month, and Concentrates grew 46.24% year over year with an 8.26% month-over-month increase. Edible slipped 29.81% month over month but was up 8.63% year over year, Capsules declined 28.13% month over month yet climbed 61.67% year over year, and Pre-Roll jumped 38.75% month over month from a smaller 3.82% share base. With an overall average price down 3.60% year over year to $33.82, the mix signals volume-led gains concentrated in Flower and Concentrates while Vapor Pens introduce short-term drag, implying that share consolidation around inhalables is advancing despite uneven monthly cadence.
Positioning-wise, the 83.99% year-over-year surge and 13.30% month-over-month gain in Flower alongside a 46.24% year-over-year and 8.26% month-over-month rise in Concentrates point to a core competency in inhalable formats, while the 17.23% month-over-month decline in Vapor Pens exposes sensitivity to assortment or promotional shifts. The 38.75% month-over-month increase in Pre-Roll at 3.82% share suggests an on-ramp for trial that can reinforce Flower leadership, whereas the 29.81% month-over-month pullback in Edible and 28.13% in Capsules constrain breadth. Given a 71.53% brand-level year-over-year sales lift and a 3.60% price decline, the configuration implies a volume-acquisition strategy centered on Flower scale with Concentrates as a premium adjacency, positioning Ancient Roots to lean into inhalables while selectively stabilizing Pen repeat and trimming exposure to slower ingestibles.
Competitive Landscape
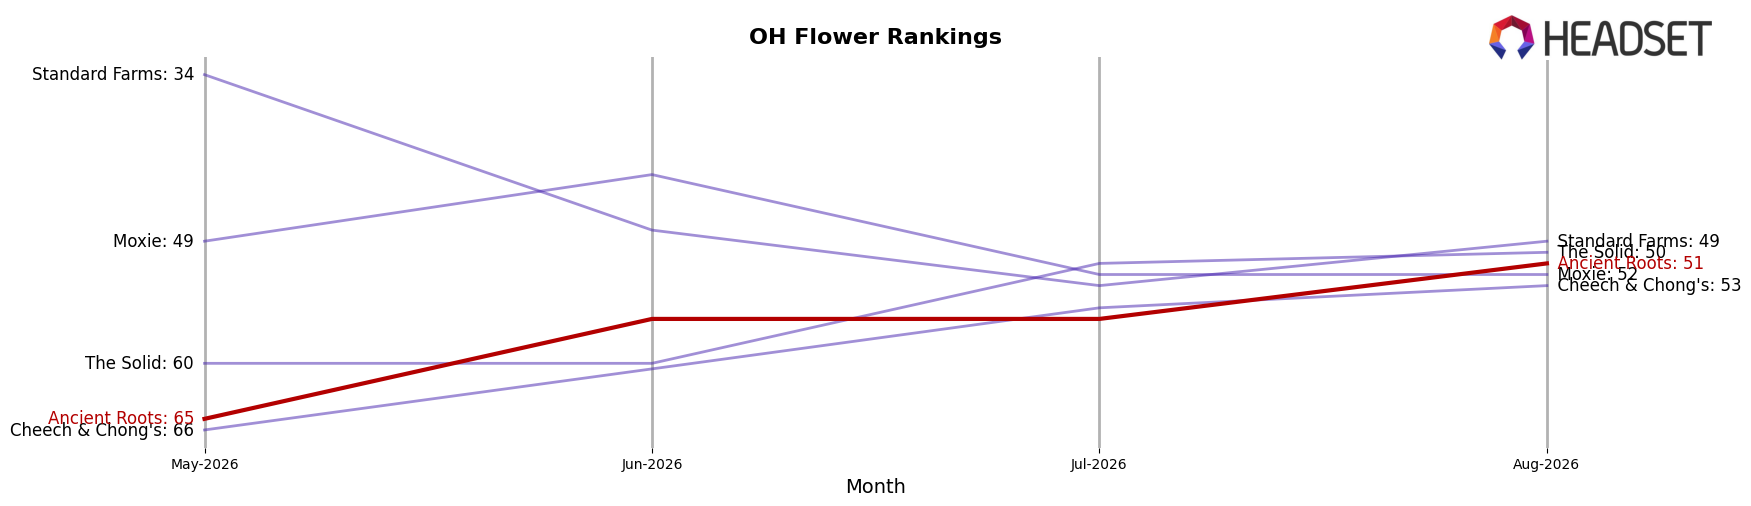
Ancient Roots ranks #51 in OH Flower in August 2026, improving 9 positions from #60 year over year, and advancing 14 positions from #65 in May 2026 while still trailing its #48 peak from November 2024; meanwhile, Klutch Cannabis moved from #19 to #1 with 362.3% YoY sales growth and RYTHM climbed from #8 to #2 with 27.3% YoY growth, indicating that Ancient Roots’ gradual rank gains are happening amid rapid top-tier acceleration that could widen the gap unless rank momentum converts into share capture.
Notable Products
Zweet Inzanity (3.5g) led August 2026 with a 217.6% month-over-month surge to $25,438 and jumped to rank 1, while RVR (3.5g) slipped 4.5% and held rank 2. LAGF (3.5g) was nearly flat at +0.8% and sat at rank 8, and Flower accounted for four of the top ten SKUs with ranks 1, 2, 6, and 8. This pattern implies a pivot toward larger and premium Flower exposure, with momentum concentrated in a single flagship SKU and headroom to consolidate share across adjacent Flower formats.
Top Selling Cannabis Brands






Data for this report comes from real-time sales reporting by participating cannabis retailers via their point-of-sale systems, which are linked up with Headset’s business intelligence software. Headset’s data is very reliable, as it comes digitally direct from our partner retailers. However, the potential does exist for misreporting in the instance of duplicates, incorrectly classified products, inaccurate entry of products into point-of-sale systems, or even simple human error at the point of purchase. Thus, there is a slight margin of error to consider. Brands listed on this page are ranked in the top twenty within the market and product category by total retail sales volume.

