.svg)

Sep-2026
Sales
Trend
6-Month
Product Count
SKUs
Avg Price
YoY Sales Change
YoY Price Change


Market Insights Snapshot
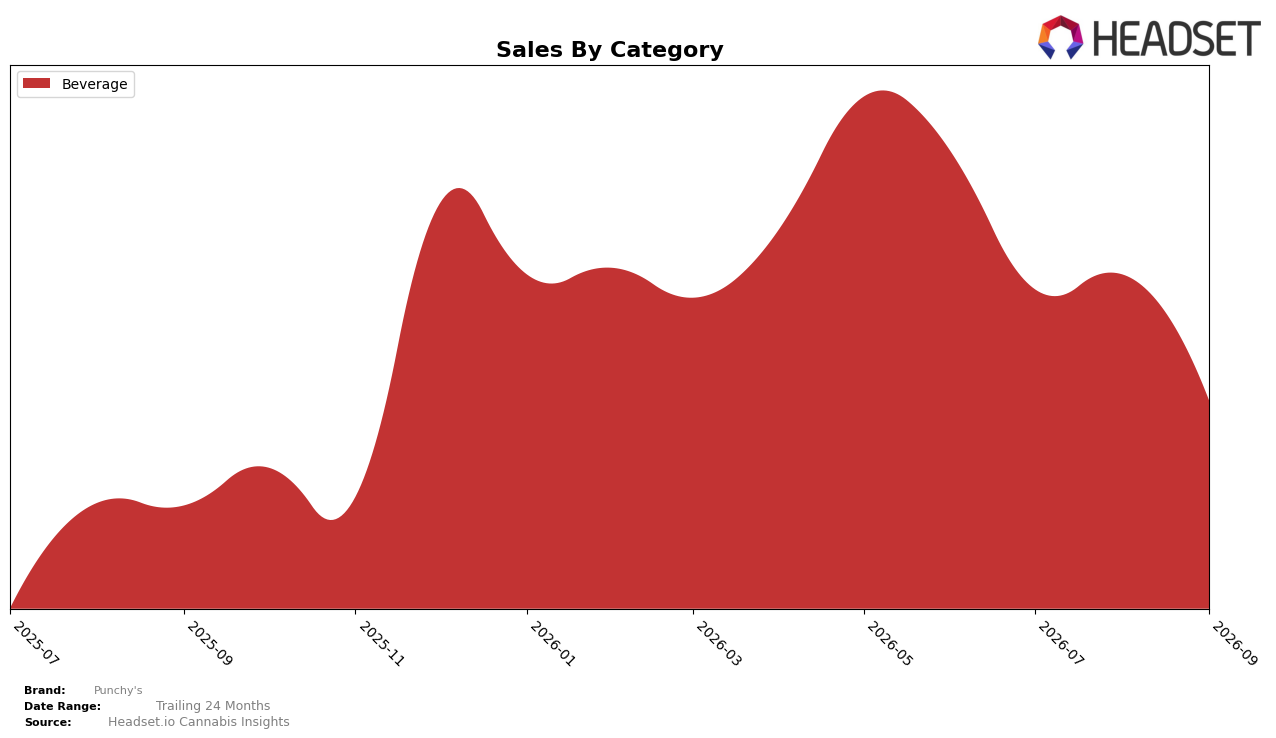
In September 2026, Punchy's operated as a single-category brand with Beverage at 100.0% of mix, pairing an 81.9% year-over-year sales increase with a -35.4% month-over-month decline, while average price rose 8.7% YoY to $5.09. This combination of a full-category concentration and opposing growth rates indicates that Punchy's expanded materially versus September 2025 but retrenched from August 2026 volumes, implying demand is tilted toward longer-cycle distribution gains rather than short-term repeat velocity.
The all-in Beverage focus at 100.0% share alongside an 81.9% YoY lift but a -35.4% MoM dip suggests positioning that depends on episodic or seasonal intake rather than diversified, steady-through-month demand. With price up 8.7% YoY, the brand is leaning on premiumization within Beverage while absorbing month-to-month volatility, implying the path to durable rank improvement in British Columbia hinges on smoothing intra-quarter swings rather than expanding into adjacent categories.
Competitive Landscape
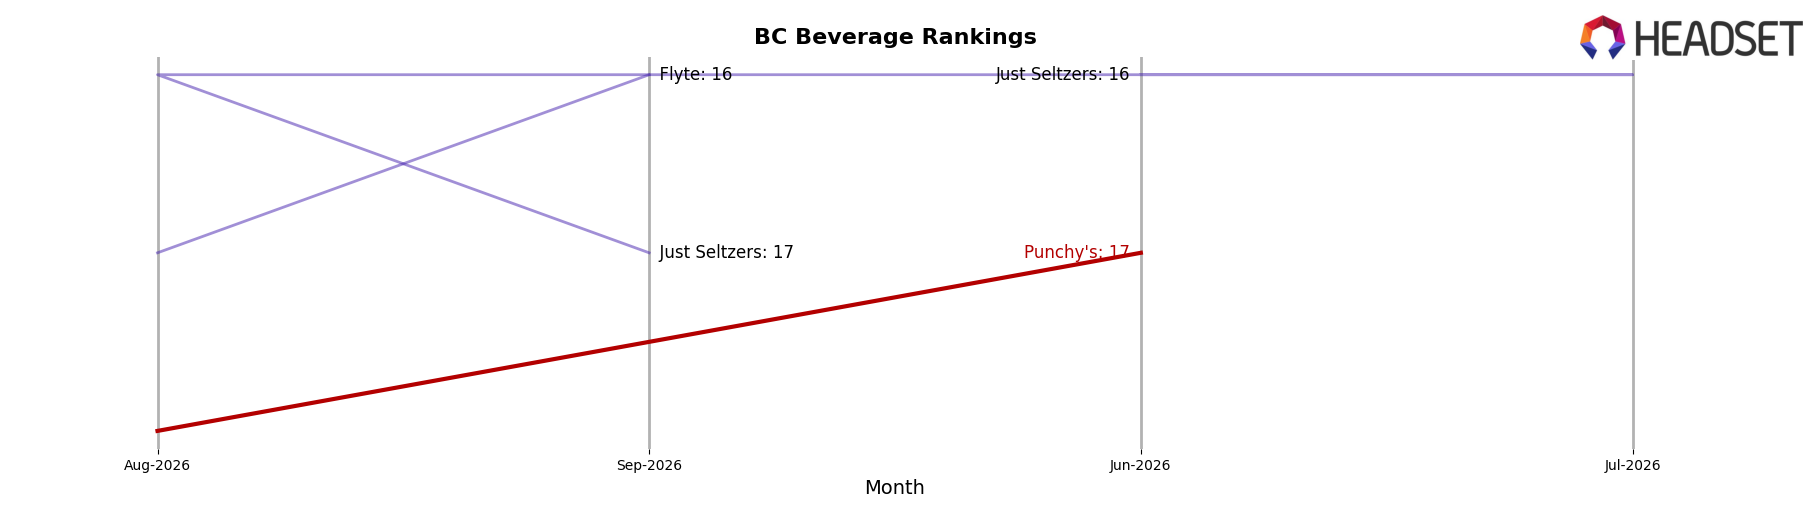
Punchy's sits at #18 in BC Beverage in September 2026, down 1 rank from June 2026’s #17 and 1 rank below its peak at #17 in July 2026; without a reported year-over-year rank baseline, the three-month slide from #17 to #18 frames a marginal loss of position while peers moved more decisively. In contrast, Mollo climbed from #3 to #2 and expanded sales by 32.6% year over year, while TeaPot jumped from #10 to #5 with 136.5% year-over-year growth, indicating faster momentum than Punchy's rank drift of -1 over the last quarter. The pattern implies Punchy's is holding mid-tier share but ceding relative velocity to faster-rising rivals, so absent a catalyst to reverse a 1-rank quarter-over-quarter decline, its trajectory points to incremental erosion rather than re-entry into the top 15.
Notable Products
Fruit Punch Soda (10mg THC, 12oz, 355ml) posted a -35.8% month-over-month decline while holding rank 1, and Citrus Punch Soda (10mg THC, 12oz, 355ml) fell -34.4% at rank 2, indicating simultaneous contraction at the top of the lineup. With both top-2 SKUs in the Beverage category and a combined September 2026 sales level of $15,268, the concentration in beverages suggests dependence on a narrow segment as momentum cools. The pattern implies Punchy's is over-indexed in two closely positioned SKUs, and near-term commercial direction likely requires SKU or format diversification to stabilize rank and reduce volatility.
Top Selling Cannabis Brands






Data for this report comes from real-time sales reporting by participating cannabis retailers via their point-of-sale systems, which are linked up with Headset’s business intelligence software. Headset’s data is very reliable, as it comes digitally direct from our partner retailers. However, the potential does exist for misreporting in the instance of duplicates, incorrectly classified products, inaccurate entry of products into point-of-sale systems, or even simple human error at the point of purchase. Thus, there is a slight margin of error to consider. Brands listed on this page are ranked in the top twenty within the market and product category by total retail sales volume.

