.svg)

Sep-2026
Sales
Trend
6-Month
Product Count
SKUs
Avg Price
YoY Sales Change
YoY Price Change


Where to Buy
Rare Dankness is stocked at 86 licensed dispensaries across Colorado and New Jersey, 85 of them in Colorado, with the deepest coverage in Colorado Springs, Denver, Pueblo, Trinidad, and Aurora. Search by ZIP code or city below to find the closest one, or filter by product type if you are after a specific format.
Market Insights Snapshot
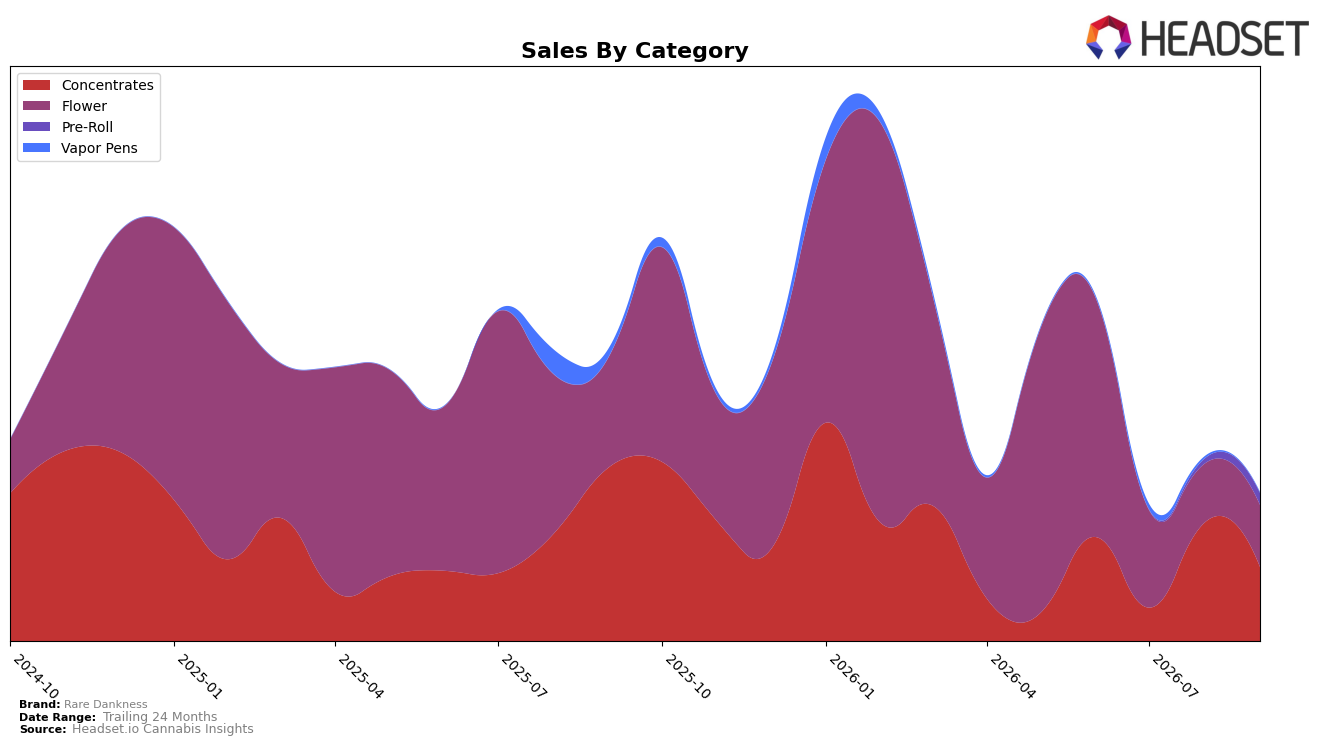
In September 2026, Rare Dankness concentrated half of its sales in Concentrates at 50.0% share while Flower accounted for 41.7% share, with Pre-Roll expanding to 7.8% and Vapor Pens shrinking to 0.4%. Concentrates contracted sharply year over year at -57.3% and slid month over month at -37.5%, whereas Flower declined -43.7% year over year but rose 5.3% month over month, indicating a partial offset. Pre-Roll surged month over month by 144.6% alongside an average price of $26.87, while Vapor Pens fell -92.3% year over year and -67.6% month over month with a 0.4% share. The mix suggests a pivot away from Vapor Pens and a weakening Concentrates core, with Pre-Roll momentum and modest Flower stabilization acting as near-term volume ballast.
These shifts reposition Rare Dankness toward a two-prong strategy: defending relevance through Flower’s 41.7% share and exploiting Pre-Roll’s 144.6% month-over-month spike, while accepting that a 50.0% Concentrates dependence is vulnerable amid a -57.3% year-over-year drop and a -37.5% month-over-month slide. The decline in Vapor Pens to 0.4% share and a -67.6% month-over-month change reduces portfolio optionality, making category diversification urgent. With the brand ranked 33 in Concentrates in Colorado and a brand-level average price down -53.7% year over year, the path forward implies migrating demand toward Flower and Pre-Roll where price elasticity appears more favorable and rank risk in Concentrates can be mitigated.
Competitive Landscape
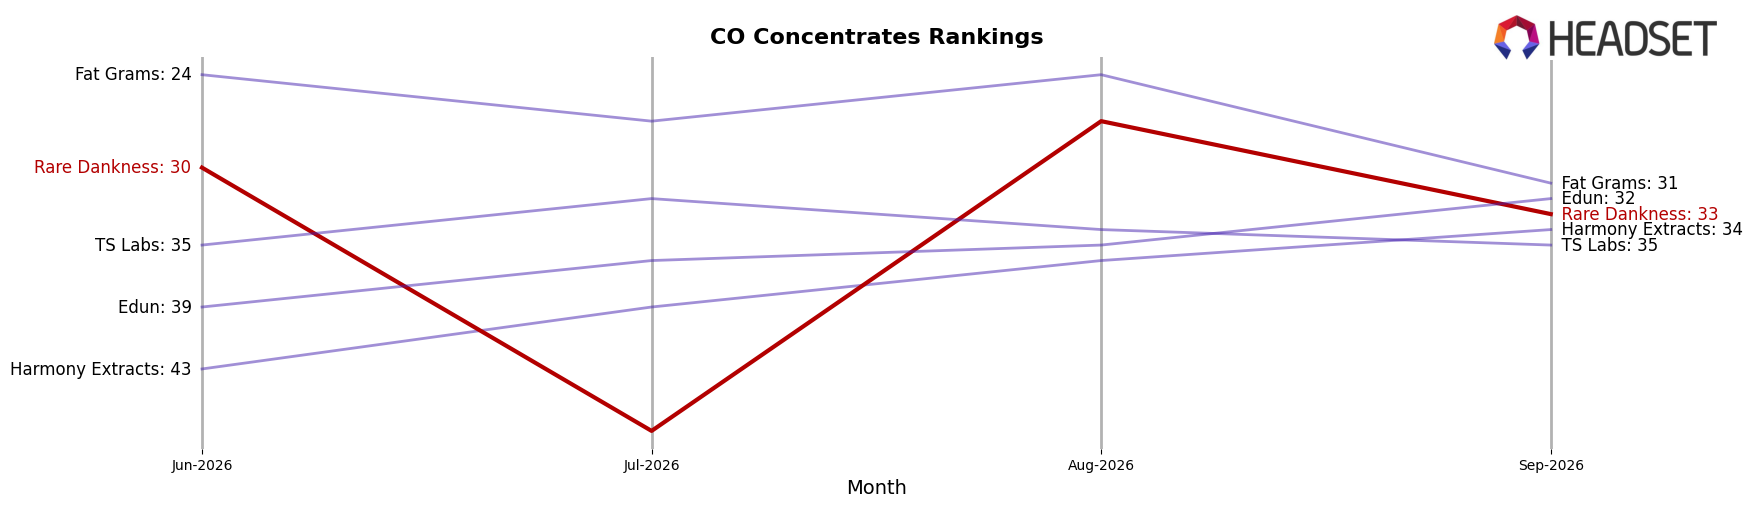
Rare Dankness sits at rank #33 in CO Concentrates in September 2026, down 9 positions year over year from #24 and slipping 3 ranks from #30 in June 2026, while its peak of #15 in January 2026 marks an 18-place drop from that high; in contrast, 710 Labs holds #1 after improving from #2 year over year despite a 18.6% sales decline, and Sunshine Extracts advanced from #6 to #2 alongside a 49.9% YoY sales increase, indicating that Rare Dankness’s downward rank trajectory amid mixed competitor momentum points to share being ceded to faster-climbing rivals.
Notable Products
Strawberry Pie Sugar Wax (1g) posted the steepest decline at -67.9% month over month and slid to rank 7, while Blue Zushi (Bulk) also contracted by -22.6% at rank 4. In contrast, Mai Tai (Bulk) surged +71.3% to rank 3 and Goldmember (Bulk) climbed +45.5% at rank 2, yet Dirty Soda Sugar Wax (1g) advanced only +13.0% at rank 6. With four of the top ten in Flower and three in Concentrates, the polarization between a +71.3% Flower gainer and a -67.9% Concentrate decliner implies Rare Dankness is tilting mix toward bulk Flower while reassessing underperforming sugar wax SKUs.
Top Selling Cannabis Brands






Data for this report comes from real-time sales reporting by participating cannabis retailers via their point-of-sale systems, which are linked up with Headset’s business intelligence software. Headset’s data is very reliable, as it comes digitally direct from our partner retailers. However, the potential does exist for misreporting in the instance of duplicates, incorrectly classified products, inaccurate entry of products into point-of-sale systems, or even simple human error at the point of purchase. Thus, there is a slight margin of error to consider. Brands listed on this page are ranked in the top twenty within the market and product category by total retail sales volume.

