Aug-2025
Sales
Trend
6-Month
Product Count
SKUs
Avg Price
YoY Sales Change
YoY Price Change
Market Insights Snapshot
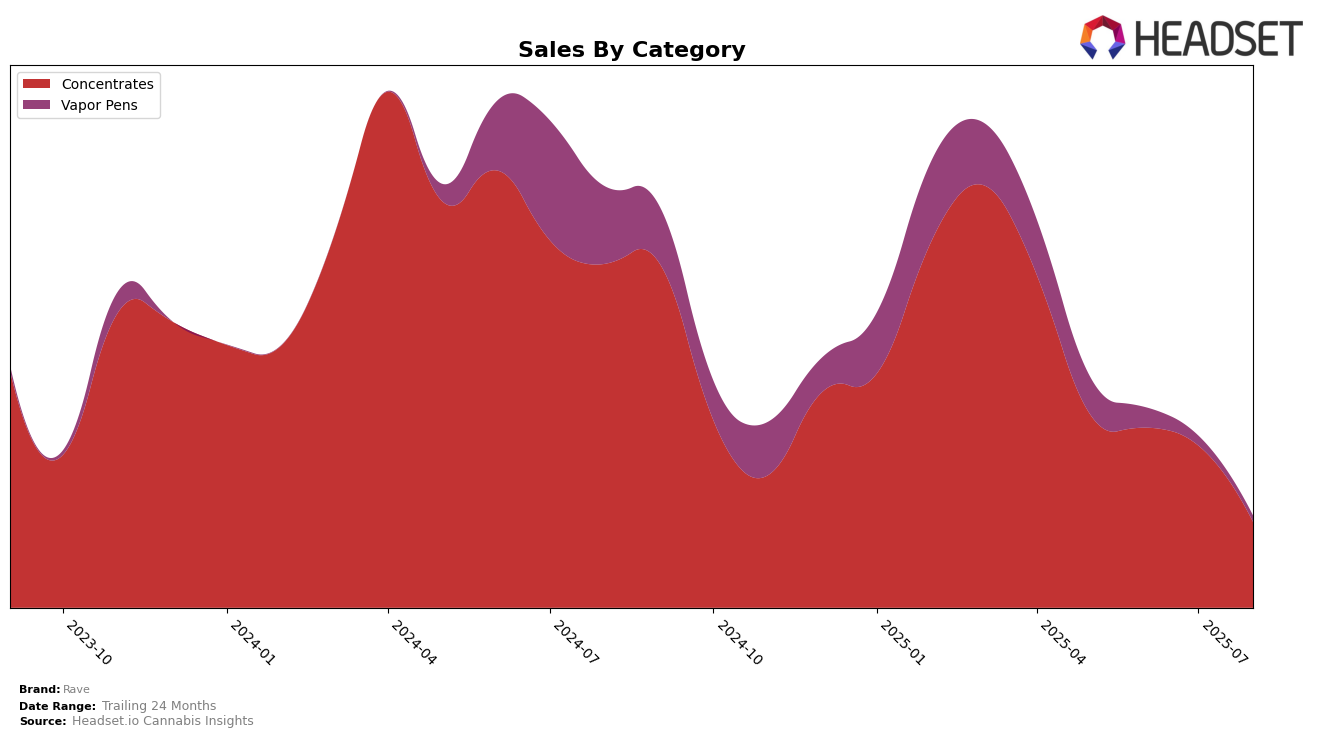
In the Massachusetts market, Rave has experienced a noticeable decline in its ranking within the Concentrates category over the summer months of 2025. Starting at 14th place in May, the brand slipped to 29th by August. This downward trend in ranking is also reflected in their sales figures, which saw a significant decrease from $74,938 in May to $32,827 in August. The consistent drop in both rank and sales suggests challenges in maintaining competitiveness or possibly a shift in consumer preferences within this category in Massachusetts.
Rave's absence from the top 30 brands in other states and categories during this period could indicate that their presence is primarily concentrated in Massachusetts, where they are still facing stiff competition. The lack of visibility in other markets might be a strategic decision or a reflection of the brand's current focus and capabilities. However, being outside the top 30 in any market is not ideal for brand visibility and growth, signaling potential areas for improvement or expansion. The data hints at a need for Rave to reassess its market strategies to regain and improve its standing in the Concentrates category, particularly in Massachusetts.
Competitive Landscape
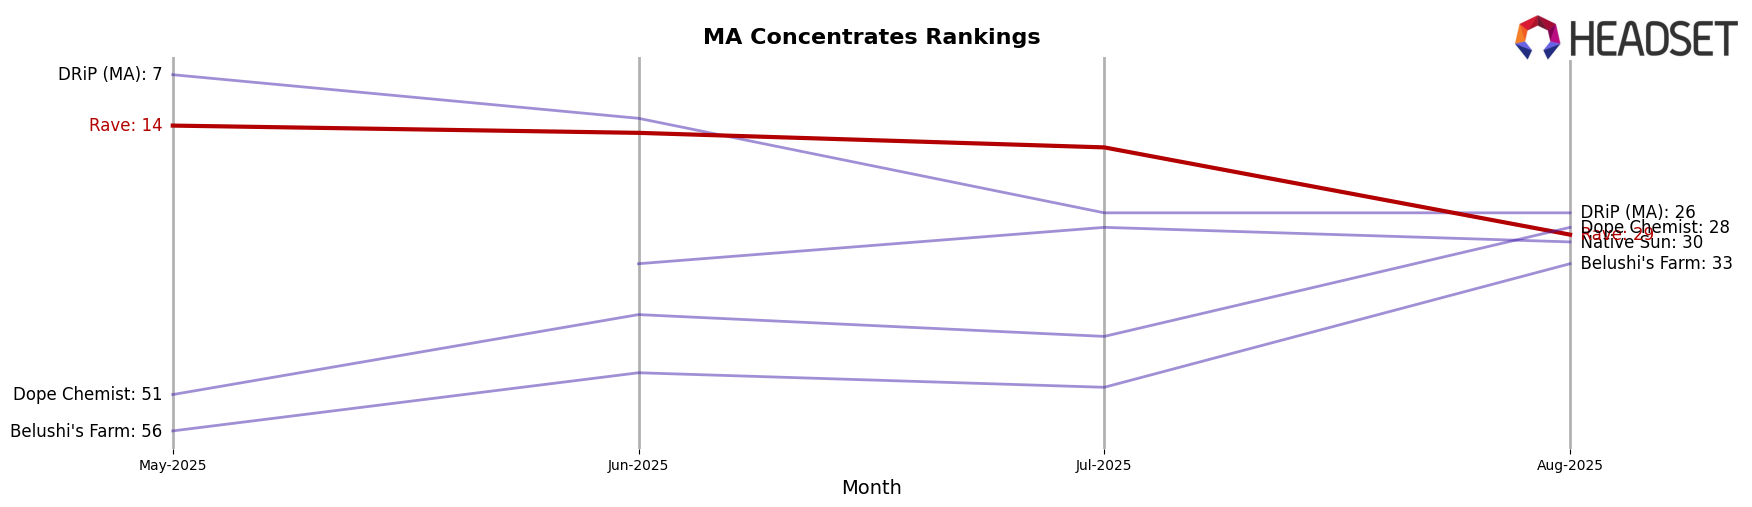
In the Massachusetts concentrates market, Rave has experienced a notable decline in its rank from May to August 2025, dropping from 14th to 29th position. This downward trend in rank correlates with a decrease in sales, suggesting a potential loss of market share. In contrast, competitors like Belushi's Farm and Dope Chemist have shown significant improvements in their rankings, with Belushi's Farm rising from outside the top 20 to 33rd place and Dope Chemist climbing from 51st to 28th. Meanwhile, DRiP (MA) maintained a stable position at 26th in July and August, after a sharp decline from 7th in May. Native Sun also showed a consistent presence in the top 30, indicating steady performance. The competitive landscape suggests that Rave may need to reassess its strategies to regain its previous standing and counter the rising momentum of its competitors.
Notable Products
In August 2025, Devil Driver Badder (1g) emerged as the top-performing product for Rave, ascending from its fifth-place position in July to claim the number one spot with sales reaching 356 units. Mountaintop Mint Wax (1g) followed closely, securing the second rank, a slight improvement from its fourth-place ranking in July. Flower Power Sugar (3.5g) made a notable entry into the top three, marking its debut in the rankings. Crazy Train Badder (1g) returned to the rankings, holding the fourth position after being unranked in July. Dosido Badder (1g) experienced a significant drop, falling from first place in July to fifth in August, with sales decreasing to 79 units.
Top Selling Cannabis Brands
Data for this report comes from real-time sales reporting by participating cannabis retailers via their point-of-sale systems, which are linked up with Headset’s business intelligence software. Headset’s data is very reliable, as it comes digitally direct from our partner retailers. However, the potential does exist for misreporting in the instance of duplicates, incorrectly classified products, inaccurate entry of products into point-of-sale systems, or even simple human error at the point of purchase. Thus, there is a slight margin of error to consider. Brands listed on this page are ranked in the top twenty within the market and product category by total retail sales volume.

