Mar-2026
Sales
Trend
6-Month
Product Count
SKUs
Avg Price
YoY Sales Change
YoY Price Change
Market Insights Snapshot
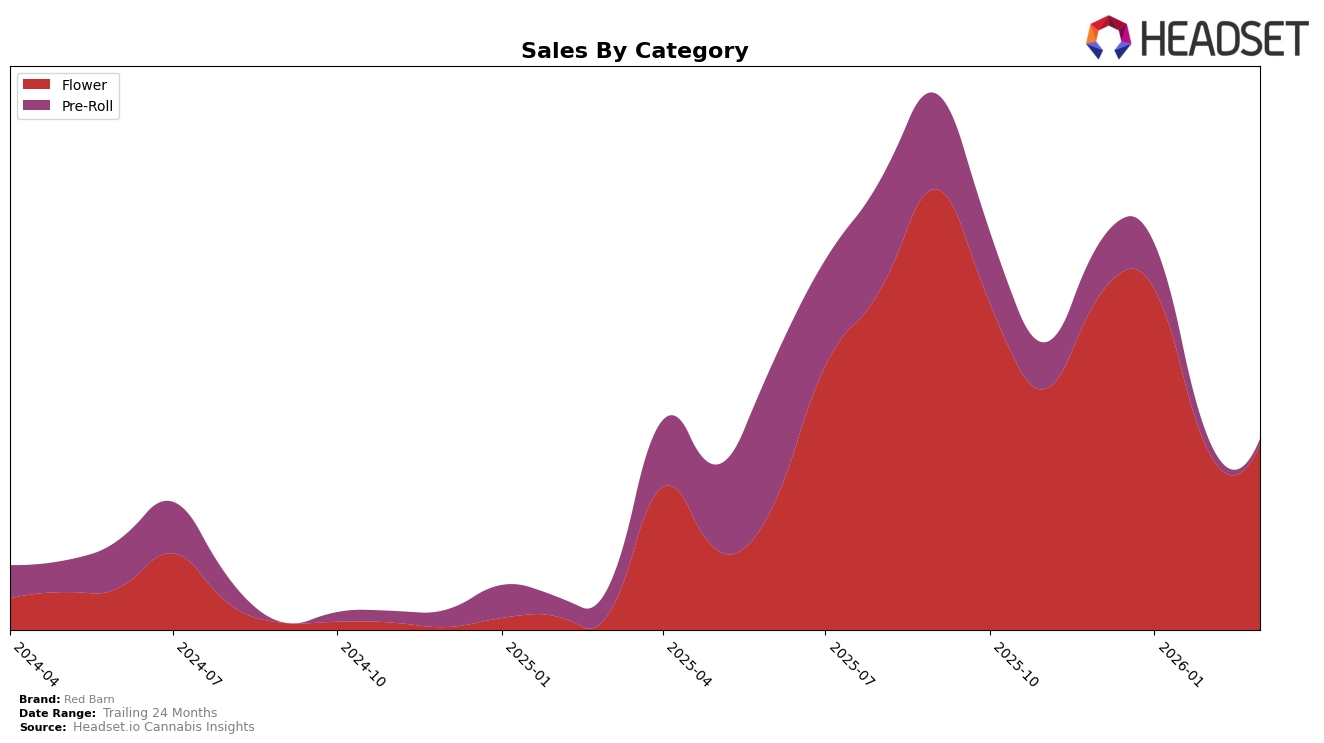
Red Barn has shown varying performance across different categories and regions, particularly in Saskatchewan. In the Flower category, Red Barn maintained a consistent ranking at 12th place in December 2025 and January 2026, but experienced a decline in the following months, falling to 23rd in February and 26th in March. This downward trend in rankings aligns with a noticeable drop in sales from January to February, suggesting challenges in maintaining their competitive edge in this category. Meanwhile, the Pre-Roll category in Saskatchewan presents a different scenario, with Red Barn failing to secure a position within the top 30 brands after January 2026. This absence indicates a potential struggle or shift in market strategy that might need addressing to regain traction.
The performance of Red Barn across these categories highlights significant movements that could inform future strategies. The consistent presence in the Flower category, despite a decline in rankings, suggests a core market where Red Barn has established a foothold. However, the inability to remain in the top 30 for Pre-Rolls after January may indicate either increased competition or a shift in consumer preferences that Red Barn has yet to adapt to. These insights provide a glimpse into Red Barn's market dynamics, offering a foundation for deeper analysis into how the brand might optimize its positioning and product offerings to enhance its market performance in Saskatchewan and potentially other regions.
Competitive Landscape
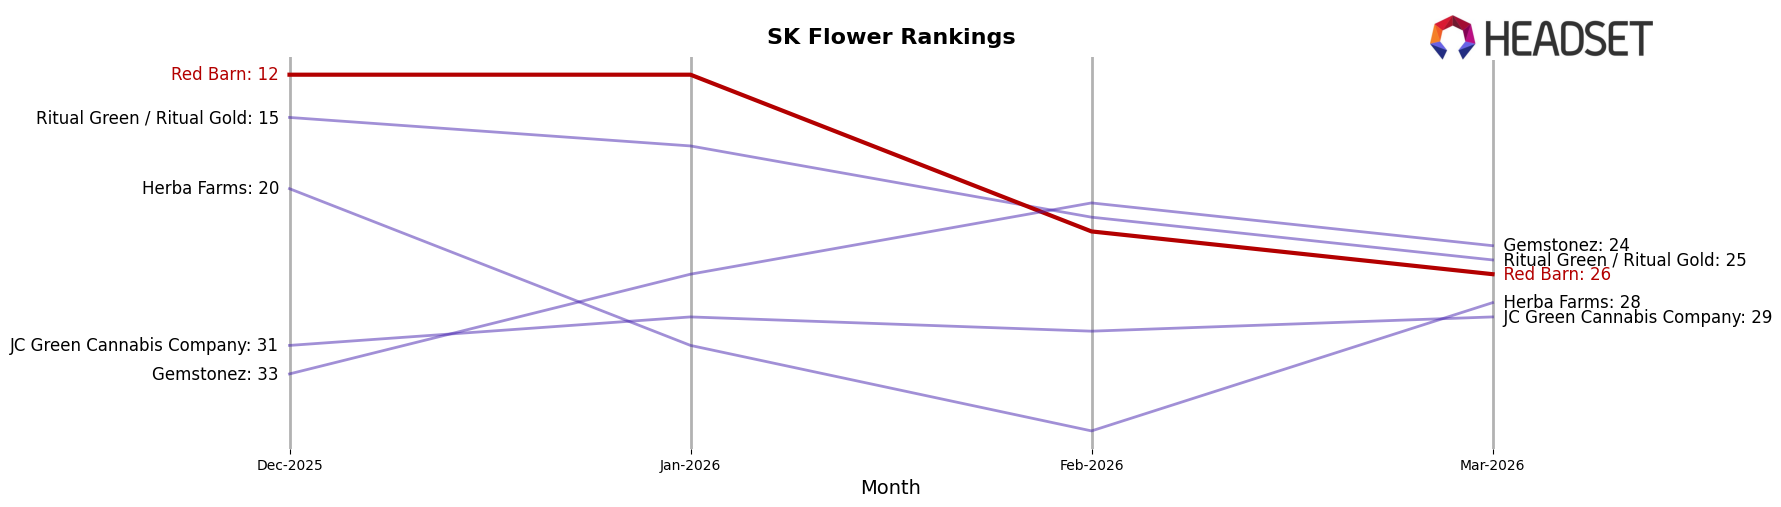
In the competitive landscape of the Flower category in Saskatchewan, Red Barn experienced notable fluctuations in its market position from December 2025 to March 2026. Initially ranked at 12th place in December 2025 and January 2026, Red Barn saw a significant drop to 23rd in February and further to 26th in March. This decline in rank coincided with a decrease in sales from January to February, although there was a slight recovery in March. Meanwhile, competitors like Ritual Green / Ritual Gold also experienced a downward trend, falling from 15th in December to 25th in March, which suggests a broader market shift. On the other hand, Gemstonez improved its ranking from 33rd in December to 24th in March, indicating a positive sales trajectory. These dynamics highlight the volatility in the market and suggest that Red Barn may need to reassess its strategies to regain its competitive edge and stabilize its sales performance.
Notable Products
In March 2026, Chem Fuel (3.5g) emerged as the top-performing product for Red Barn, achieving the number one rank with a notable sales figure of 316 units. Following closely behind, 91 Royale Diesel (7g), Jokerz Gas (7g), and MK Kush (28g) all shared the second rank, each with sales of 155 units. Strawberry Sour Diesel (7g) secured the third position with sales totaling 125 units. Compared to previous months, Chem Fuel (3.5g) saw a significant rise to the top spot, indicating a growing preference among consumers. The consistent rankings of the other products from previous months suggest stable demand within their respective categories.
Top Selling Cannabis Brands
Data for this report comes from real-time sales reporting by participating cannabis retailers via their point-of-sale systems, which are linked up with Headset’s business intelligence software. Headset’s data is very reliable, as it comes digitally direct from our partner retailers. However, the potential does exist for misreporting in the instance of duplicates, incorrectly classified products, inaccurate entry of products into point-of-sale systems, or even simple human error at the point of purchase. Thus, there is a slight margin of error to consider. Brands listed on this page are ranked in the top twenty within the market and product category by total retail sales volume.

