Jun-2026
Sales
Trend
6-Month
Product Count
SKUs
Avg Price
YoY Sales Change
YoY Price Change
Market Insights Snapshot
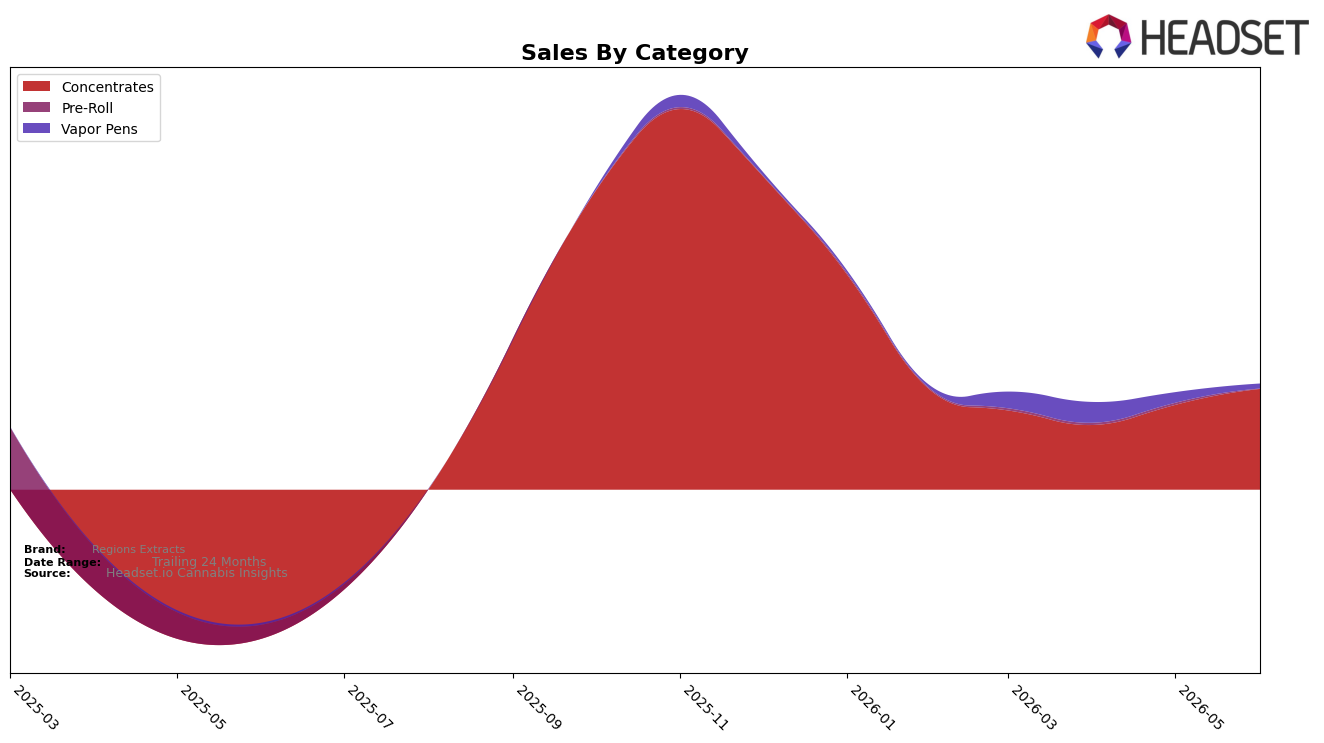
Regions Extracts concentrated its June 2026 revenue in Concentrates at 95.56% share, while Vapor Pens held 4.44% share; month over month, Concentrates rose 18.95% as Vapor Pens fell 54.67%, indicating a redistribution toward extracts rather than a broad portfolio expansion. With an average price of $9.57 in Concentrates versus a higher $17.84 in Vapor Pens, the mix shift suggests volume is consolidating where price points are lower and velocity is higher, and the June 2026 rank of 28 in Concentrates within Arizona frames this pivot as a category-focused push rather than a cross-category play.
The contrasting 18.95% month-over-month lift in Concentrates against the 54.67% decline in Vapor Pens implies Regions Extracts is leaning into a single-category identity to stabilize rank at 28 while curbing exposure to higher-priced, smaller-share formats. This concentration of 95.56% share in Concentrates alongside only 4.44% in Vapor Pens points to a positioning strategy that favors depth over breadth, improving near-term execution in extracts at the expense of diversification, which may enhance competitiveness within Arizona Concentrates while leaving limited buffer if category momentum softens.
Competitive Landscape
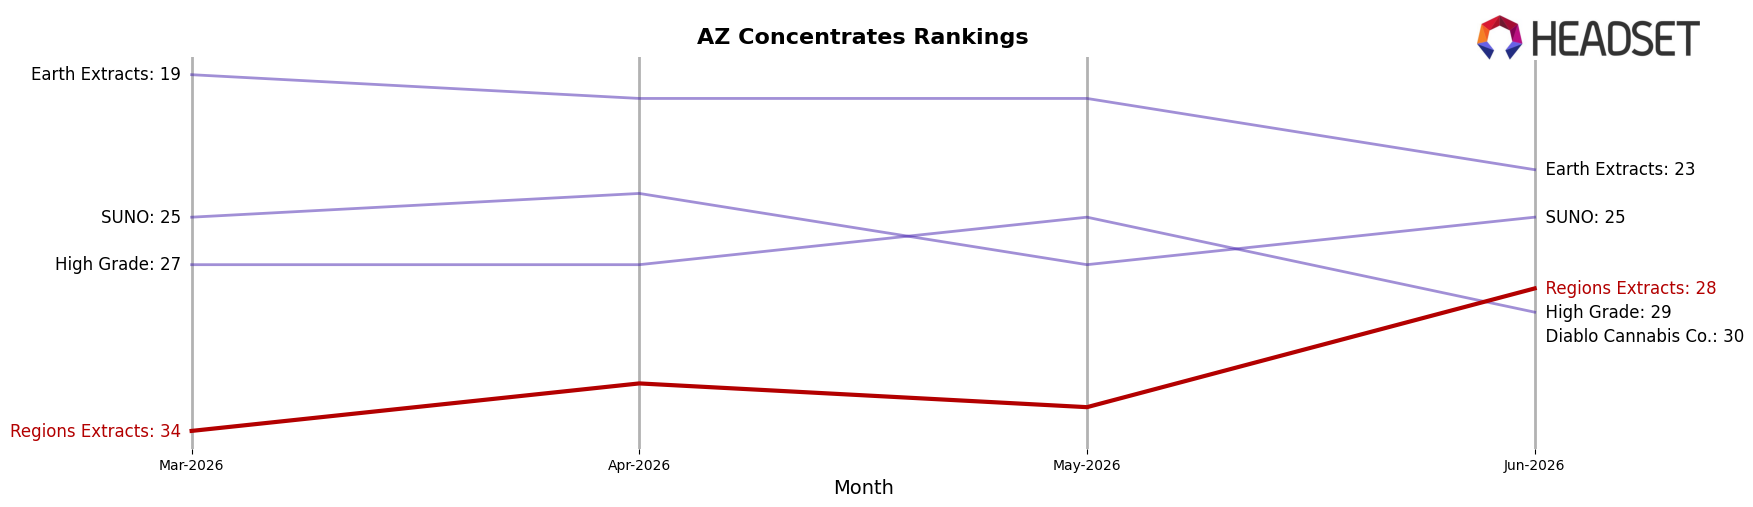
Regions Extracts ranks #28 in AZ Concentrates in June 2026, improving 6 positions from #34 in March 2026 but sitting 17 places below its peak of #11 from November 2025; this contrasts with Mohave Cannabis Co. holding #1 with 176.4% year-over-year sales growth while WTF Extracts slipped from #3 to #5 alongside a 14.4% decline, and the mix of upward moves like Grow Sciences jumping from #7 to #4 with 106.5% growth versus Canamo staying at #2 despite a 19.7% fall signals that Regions Extracts’ mid-pack ascent is happening amid volatility at the top; the pattern implies a recovery trajectory that is measurable in rank gains but still constrained by a widened gap from leadership positions, requiring share capture during competitor downturns rather than relying on category tide alone.
Notable Products
Doxie Live Resin Sugar Wax (1g) delivered the sharpest movement in June 2026 with a +251% month-over-month surge to rank 1, while Margy Cake Badder (1g) fell -51% and slid to rank 7. Summer Monsoon Badder (1g) rose +41% to rank 2 as Super Lemon Haze Badder (1g) declined -27% at rank 9, and four of the top ten are Badder SKUs, indicating a split between a few momentum drivers and several retreating textures. White Widow Shatter (1g) climbed +40% at rank 6 versus Jack Herer Live Sugar (1g) dropping -39% at joint rank 4, and the $5,249 registered by Summer Monsoon Badder (1g) did not translate into a rank lead over Doxie Live Resin Sugar Wax (1g). The pattern implies Regions Extracts is tilting toward live sugar-led wins with selective Badder resilience, suggesting future assortment should consolidate around fast-moving live formats while pruning underperforming Badder variants.
Top Selling Cannabis Brands
Data for this report comes from real-time sales reporting by participating cannabis retailers via their point-of-sale systems, which are linked up with Headset’s business intelligence software. Headset’s data is very reliable, as it comes digitally direct from our partner retailers. However, the potential does exist for misreporting in the instance of duplicates, incorrectly classified products, inaccurate entry of products into point-of-sale systems, or even simple human error at the point of purchase. Thus, there is a slight margin of error to consider. Brands listed on this page are ranked in the top twenty within the market and product category by total retail sales volume.

