.svg)
Aug-2026
Sales
Trend
6-Month
Product Count
SKUs
Avg Price
YoY Sales Change
YoY Price Change


Market Insights Snapshot
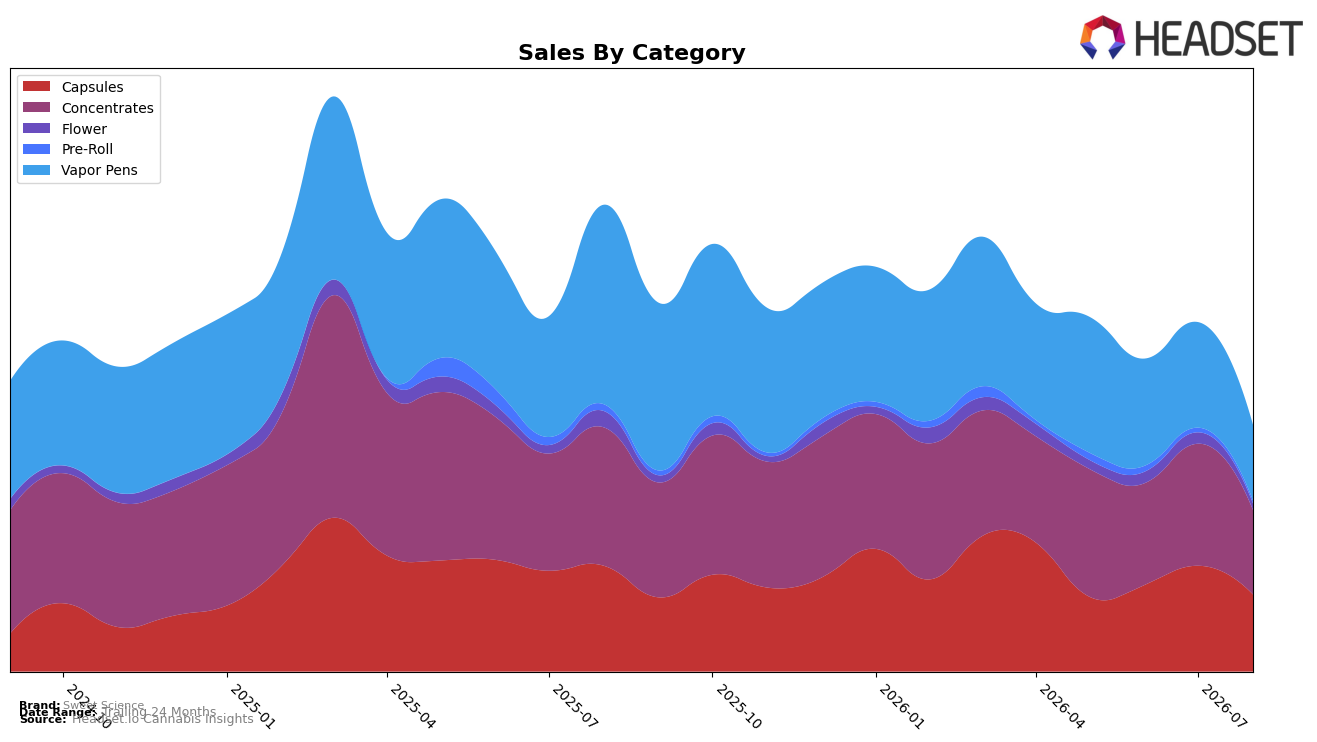
In August 2026, Sweet Science’s mix concentrated into three core categories: Concentrates at 34.26% share with year-over-year down 39.11% and month-over-month down 30.93%, Capsules at 31.29% share with year-over-year down 27.24% and month-over-month down 27.28%, and Vapor Pens at 30.74% share with year-over-year down 62.14% and month-over-month down 28.39%; trailing tiers, Flower at 2.58% share fell 60.65% year-over-year and 43.31% month-over-month, while Pre-Roll at 1.13% share declined 57.73% year-over-year and 37.33% month-over-month. With the brand ranked 26 in Concentrates in Arizona and an overall brand sales decline of 47.29% year-over-year alongside a modest average price contraction of 0.58%, the pattern implies heavier reliance on lower-priced Concentrates and Capsules is not offsetting sharp Vapor Pens erosion, pulling total velocity down.
The shifts imply Sweet Science’s positioning is skewing toward value-led conversion in Concentrates and Capsules, where double-digit month-over-month drops of 30.93% and 27.28% respectively suggest price-sensitive elasticity that the 0.58% brand-level price decrease is not materially addressing, while the 62.14% year-over-year decline in Vapor Pens and a 43.31% month-over-month slide in Flower indicate weakened replenishment in inhalables relative to ingestibles. Given a 24‑month sales change of −26.10% versus the current −47.29% year-over-year, the steeper recent contraction and a 26th-place rank in Concentrates point to share compression against the category’s middle tier, implying Sweet Science must either deepen differentiation within Concentrates or rebalance toward Capsules where declines are comparatively smaller to stabilize mix contribution.
Competitive Landscape
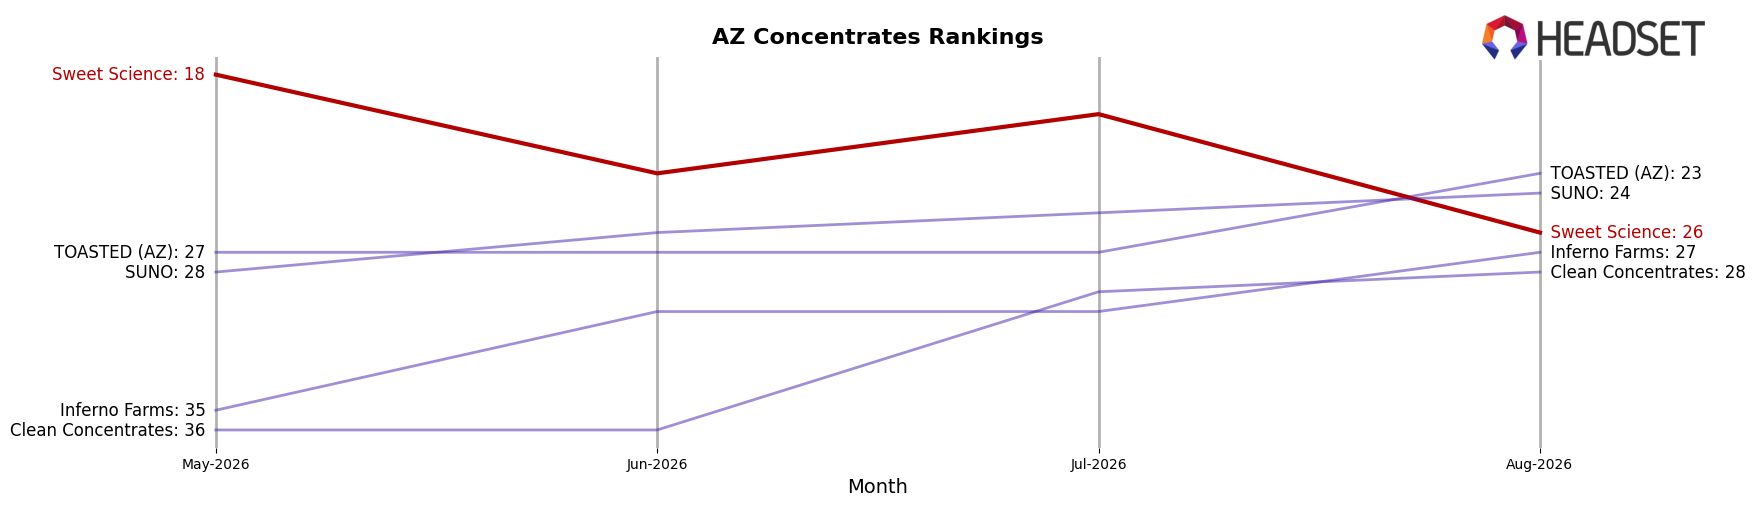
Sweet Science is currently ranked #26 in Arizona Concentrates in August 2026, a 9-place drop from #17 year over year, and down 8 places from #18 in May 2026; this sits well below its peak of #13 in March 2025 and indicates a multi-quarter slide. In contrast, Mohave Cannabis Co. held #1 with a 0-place YoY change despite a 2.65% YoY sales decline, while Grow Sciences advanced from #6 to #3 on 32.34% YoY sales growth; Hi-Klas leapt from #23 to #5 alongside a 332.24% YoY sales increase. The pattern implies Sweet Science’s descending rank and loss of 8 positions since May 2026 reflect share being ceded to faster-rising rivals, making a return toward the #13 peak unlikely without a shift in velocity drivers.
Notable Products
THC Capsules (70mg) posted the steepest movement in August 2026 with a -64.5% month-over-month decline while holding rank 1, and Lemon Cherry Gelato Crumble (1g) fell -38.2% at rank 4, indicating demand is pivoting away from smaller-dose or single-serve formats. Hardcore OG Crumble (1g) softened -4.2% at rank 2 as THC Capsules 30-Pack (750mg) in rank 3 inched up +5.6%, and five of the top ten are Concentrates SKUs, concentrating share despite mixed momentum. Watermelon Batter (1g) slid -29.6% at rank 10, contrasting with the only positive mover among leaders, THC Capsules 30-Pack (750mg), and this divergence suggests merchandising should skew toward multi-pack Capsules while pruning slower Concentrates. The pattern implies Sweet Science is consolidating around fewer, higher-commitment formats, with Concentrates breadth generating rank presence but not consistent month-over-month growth.
Top Selling Cannabis Brands






Data for this report comes from real-time sales reporting by participating cannabis retailers via their point-of-sale systems, which are linked up with Headset’s business intelligence software. Headset’s data is very reliable, as it comes digitally direct from our partner retailers. However, the potential does exist for misreporting in the instance of duplicates, incorrectly classified products, inaccurate entry of products into point-of-sale systems, or even simple human error at the point of purchase. Thus, there is a slight margin of error to consider. Brands listed on this page are ranked in the top twenty within the market and product category by total retail sales volume.

