.svg)

Sep-2026
Sales
Trend
6-Month
Product Count
SKUs
Avg Price
YoY Sales Change
YoY Price Change


Where to Buy
Retro is stocked at 88 licensed dispensaries across Colorado and Minnesota, 50 of them in Colorado, with the deepest coverage in Colorado Springs, Denver, Fort Collins, Pueblo West, and Aurora. Search by ZIP code or city below to find the closest one, or filter by product type if you are after a specific format.
Market Insights Snapshot
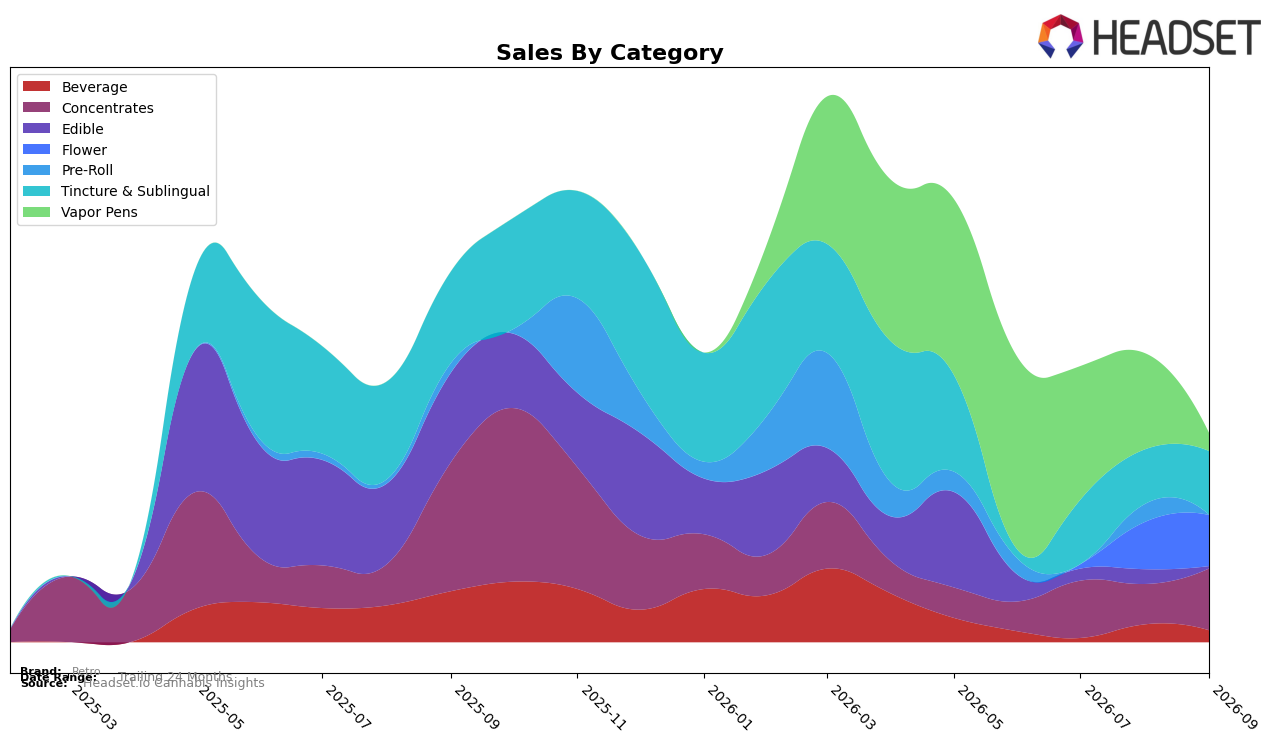
In September 2026, Retro’s category mix concentrated in Tincture & Sublingual at 30.63% share with a -30.48% year-over-year change, while Concentrates held 29.78% share with a -51.90% year-over-year change; together they accounted for 60.41% of sales despite the brand’s overall -43.83% year-over-year sales decline and a 4.13% average price increase. Month over month, Concentrates surged 53.85% and Tincture & Sublingual rose 16.77%, contrasted by Vapor Pens dropping -81.81% and Beverage falling -33.52%, indicating a pivot toward ingestible and extract formats and away from inhalable convenience products as the brand’s near-term demand base consolidates.
These shifts imply Retro is leaning into categories with higher purchase intensity per basket while trimming exposure to volatile, lower-repeat segments; Flower’s 24.47% share alongside a 7.84% month-over-month lift provides a stabilizer, whereas Vapor Pens at 8.42% share with a steep -81.81% month-over-month decline signals reduced traction in fast-turn formats. With Edible down -85.68% month over month and -97.66% year over year but Beverage still at 5.70% share despite a -33.52% month-over-month slide, the portfolio now skews toward fewer, deeper lanes, which positions Retro to rebuild baseline velocity in Tincture & Sublingual and Concentrates while accepting lower visibility in impulse-driven categories.
Competitive Landscape
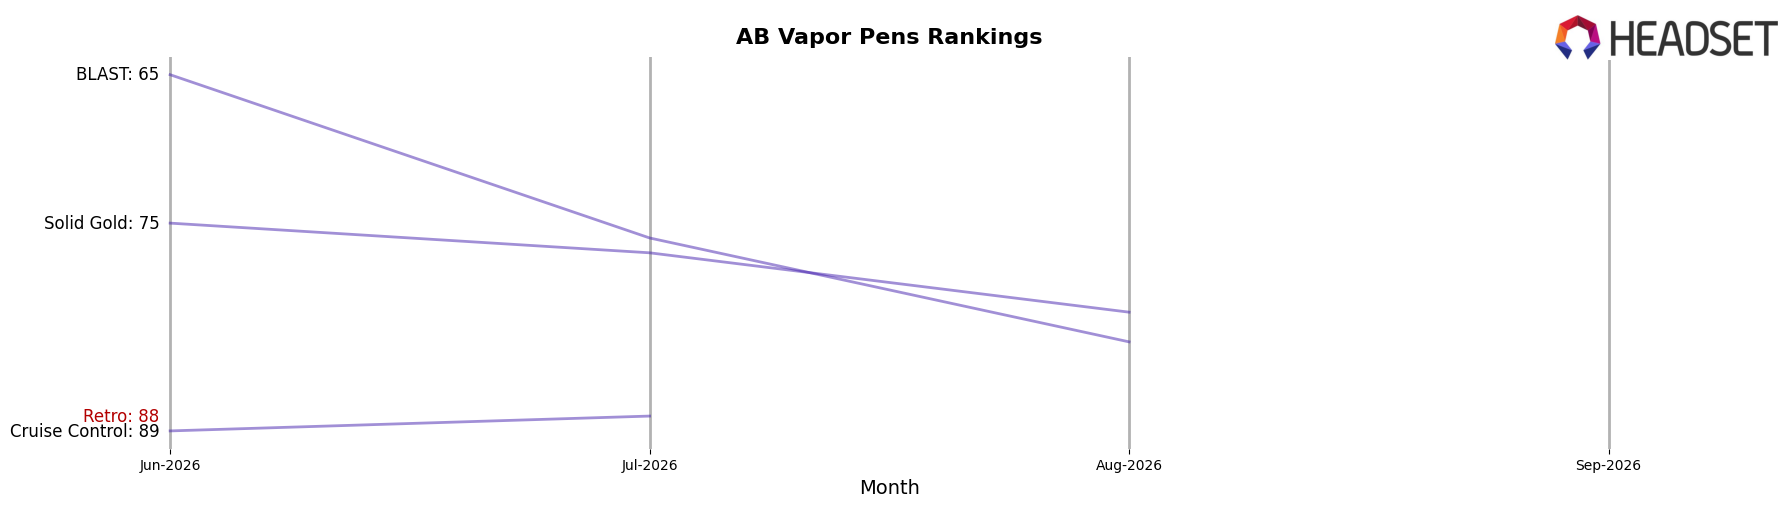
Retro ranks #107 in AB Vapor Pens in September 2026, down 19 positions from #88 in June 2026, and sits 19 ranks below its June 2026 peak of #88 while the category leaders are advancing; for example, BoxHot is #1 with a 56.6% year-over-year sales increase and Kolab moved to #4 with a 8-rank climb alongside 66.0% YoY growth, whereas General Admission is #5 despite a 21.2% YoY decline—this divergence, paired with Retro’s 19-rank slide since June 2026, implies Retro is losing visibility in faster-growing price-tier or format niches that competitors are capturing.
Notable Products
Pink Kush Full Spectrum Honey Oil Cartridge (1g) posted the steepest movement in September 2026 with a -81.8% month-over-month drop and a fall to rank 5, indicating a sharp reset for Vapor Pens within the top tier. In contrast, Honey Oil Infused Hash (2g) climbed +53.8% MoM to rank 3 while Liquid Solventless Drop Tincture (100mg) advanced +16.8% MoM at rank 1, and together these shifts imply spend is tilting from inhalables toward solventless and tincture formats. Three of the top ten are Beverage SKUs, yet Blue Razz Vibes Syrup (100mg) declined -36.7% MoM at rank 6 and Strawberry Vibes Syrup (100mg) fell -29.2% MoM at rank 7, pointing to breadth without momentum in that category. With Edibles like Peach Rings Gummies 10-Pack (100mg) down -85.7% MoM at rank 8 and only one SKU above $3,800 in September 2026, the product mix signals Retro’s near-term commercial direction favors niche potency-led formats over mainstream snacking and flavored syrups.
Top Selling Cannabis Brands






Data for this report comes from real-time sales reporting by participating cannabis retailers via their point-of-sale systems, which are linked up with Headset’s business intelligence software. Headset’s data is very reliable, as it comes digitally direct from our partner retailers. However, the potential does exist for misreporting in the instance of duplicates, incorrectly classified products, inaccurate entry of products into point-of-sale systems, or even simple human error at the point of purchase. Thus, there is a slight margin of error to consider. Brands listed on this page are ranked in the top twenty within the market and product category by total retail sales volume.

