.svg)

Sep-2026
Sales
Trend
6-Month
Product Count
SKUs
Avg Price
YoY Sales Change
YoY Price Change


Market Insights Snapshot
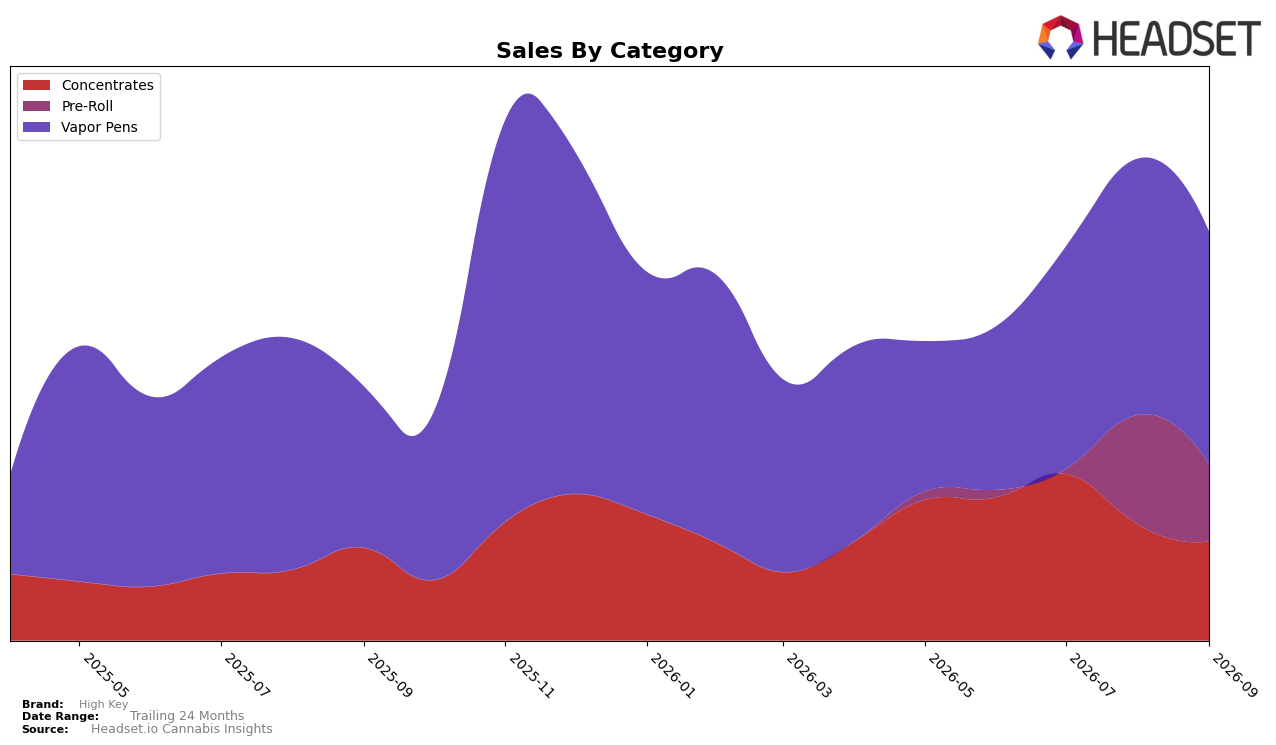
In September 2026, Vapor Pens held 57.05% share with year-over-year growth of 44.58% but a month-over-month decline of 9.21%, while Concentrates captured 24.28% share with 7.38% YoY growth and a 14.78% MoM drop; Pre-Roll rounded out the mix at 18.67% share with a 30.13% MoM contraction and no YoY comp. Despite a 61.10% YoY lift at the brand level, the average price fell 34.37% YoY to $25.99, and within the lead category the average price sat at 32.66, indicating mix- and price-driven volume expansion coexisting with near-term retrenchment. The pattern implies High Key is leaning on Vapor Pens for scale while discounting to accelerate unit velocity, but short-term MoM pullbacks across all three categories signal a need to stabilize promotional cadence to protect share.
With Vapor Pens anchoring the portfolio and a category rank of 29 in British Columbia, the combination of a 57.05% mix weight and 44.58% YoY growth alongside a 9.21% MoM dip points to a scale position that is vulnerable to month-to-month price sensitivity. Concurrently, Concentrates at 24.28% share with a 14.78% MoM decline and Pre-Roll at 18.67% share with a 30.13% MoM decline suggest peripheral categories are not absorbing volatility, raising concentration risk if Vapor Pens softens. The implication is a positioning concentrated in value-forward Vapor Pens, where price-led gains can lift rank in British Columbia if sustained, but the current MoM declines indicate the brand must diversify unit growth into Concentrates or Pre-Rolls to reduce reliance on a single category’s promotional cycle.
Competitive Landscape
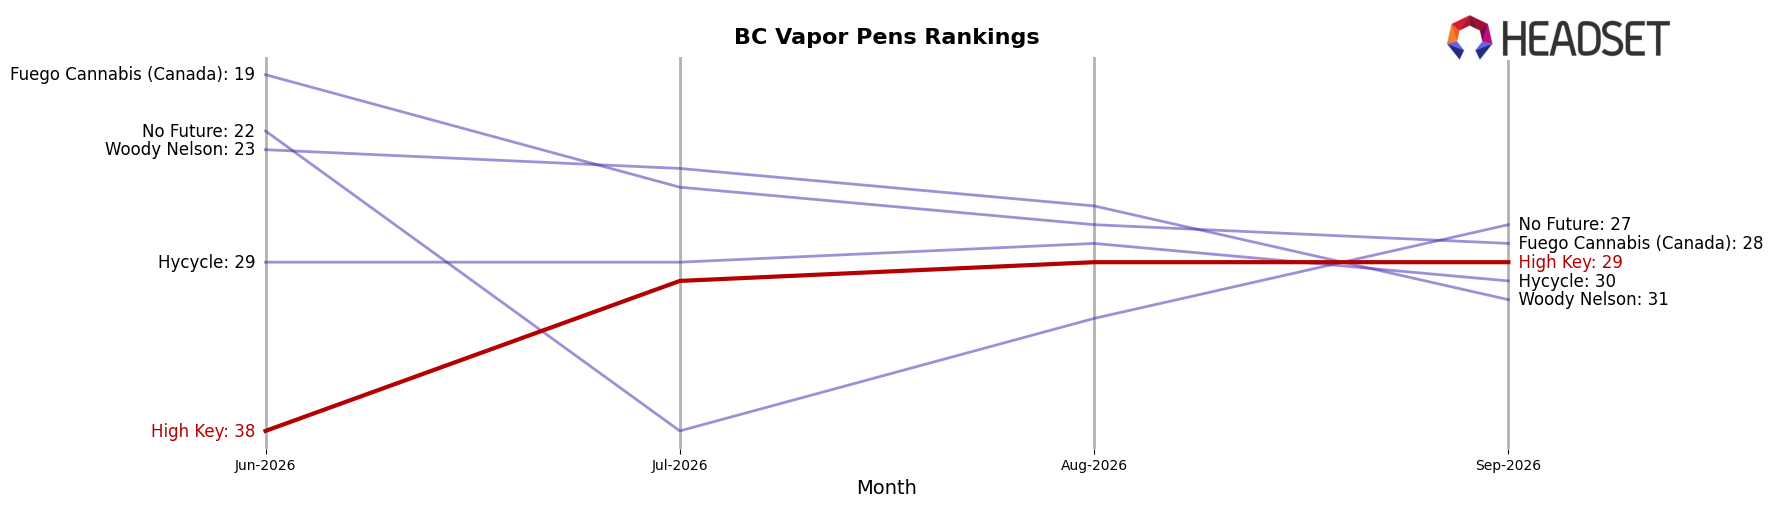
High Key ranks #29 in BC Vapor Pens in September 2026, improving 2 positions year over year from #31 and jumping 9 spots since June 2026 from #38, while still trailing its October 2025 peak at #15; in contrast, BoxHot held #1 with a 35.9% YoY sales increase and Spinach climbed from #3 to #2 alongside a 178.8% YoY sales gain, whereas General Admission slipped from #2 to #3 with a -13.9% YoY decline. This combination of a 2-rank YoY rise and a 9-rank quarter-on-quarter rebound indicates momentum back toward mid-tier visibility, but the gap to prior peak (#15) and leaders at #1–#3 implies that sustained share capture is needed to convert recovery into durable placement.
Notable Products
Huckleberry Pi Infused Pre-Roll 3-Pack (2.25g) posted the steepest decline at -46.41% MoM while slipping to rank 3, whereas Ice Cream Cake Live Resin Gembar Disposable (1g) fell -15.84% MoM but held rank 1, signaling margin pressure atop the chart rather than a share handoff. In contrast, CBD/THC 1:1 Blueberry Ice Live Resin Disposable (2g) grew 14.37% MoM to rank 4, and Ice Cream Cake Live Resin (1.2g) gained 13.66% MoM at rank 5, indicating that value- or effect-led vape formats are offsetting declines in other lines. Four of the top ten are Pre-Roll SKUs, yet their momentum lags as Huckleberry Pi Live Resin (1.2g) contracted -25.56% MoM at rank 6 and two Pre-Roll entries share rank 9, implying mix shift toward Live Resin disposables even as overall ranks concentrate in vapes. The pattern implies a commercial pivot toward Live Resin vape dominance with selective 1:1 innovation cushioning category volatility while multi-pack and single-stick Pre-Rolls face retrenchment.
Top Selling Cannabis Brands






Data for this report comes from real-time sales reporting by participating cannabis retailers via their point-of-sale systems, which are linked up with Headset’s business intelligence software. Headset’s data is very reliable, as it comes digitally direct from our partner retailers. However, the potential does exist for misreporting in the instance of duplicates, incorrectly classified products, inaccurate entry of products into point-of-sale systems, or even simple human error at the point of purchase. Thus, there is a slight margin of error to consider. Brands listed on this page are ranked in the top twenty within the market and product category by total retail sales volume.

