Market Insights Snapshot
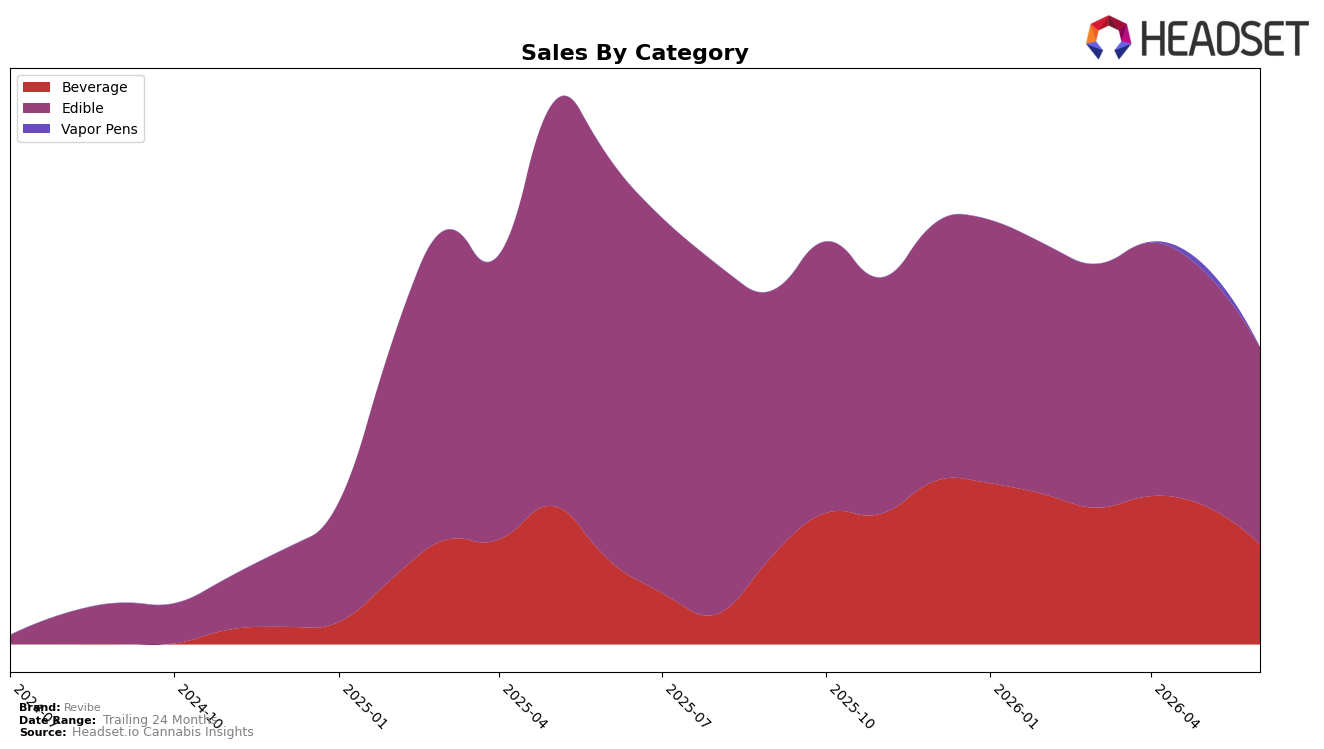
In June 2026, Revibe’s category mix concentrated 66.34% of sales in Edible with a 51.10% year-over-year decline and a 15.75% month-over-month drop, while Beverage held 33.66% share with 17.98% year-over-year growth but a 27.81% month-over-month contraction. Average price fell 17.44% year over year to $15.72, with Edible pricing at 16.05 and Beverage at 15.10, and Revibe ranked 20 in Edible within Ohio. The pattern implies Revibe is leaning on a shrinking Edible base while Beverage acts as the only year-over-year growth engine, so short-term demand volatility is rising as month-over-month declines hit both categories.
The divergence—Edible’s share dominance at 66.34% alongside a 51.10% year-over-year sales decline versus Beverage’s 17.98% year-over-year increase at 33.66% share—suggests Revibe’s positioning is anchored in a legacy Edible footprint that is eroding faster than Beverage can offset. With a 27.81% month-over-month decrease in Beverage and a 15.75% month-over-month decrease in Edible, and an overall 39.10% brand sales decline year over year alongside a 20th-place Edible rank in Ohio, the implication is that near-term share stability depends on reallocating mix toward Beverage while preventing further Edible price-led degradation from a 17.44% year-over-year price cut.
Competitive Landscape
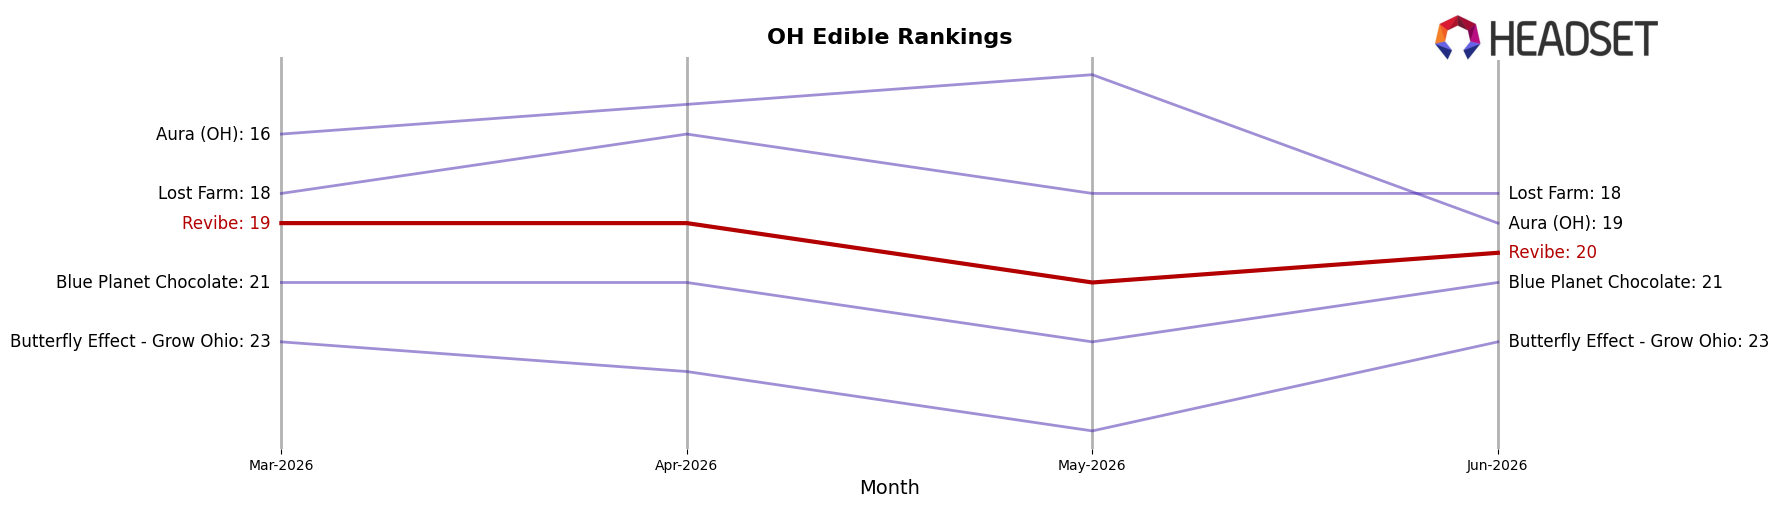
Revibe sits at rank #20 in OH Edible in June 2026, down 8 spots year over year from #12, and 1 position softer than March 2026’s #19, while its peak of #12 in July 2025 underscores the pullback. In contrast, Incredibles held #1 with a 20.1% year-over-year sales increase and Gron / Grön advanced from #7 to #2 with 79.4% YoY growth, whereas Smokiez Edibles stayed at #5 with a 6.4% sales decline; this combination of peers climbing or holding while Revibe moved from #12 to #20 implies share is consolidating up-market and Revibe’s trajectory points to erosion unless distribution, form-factor mix, or price-pack shifts are addressed.
Notable Products
Blackberry Lemonade Drink (100mg THC, 8oz, 237ml) posted the steepest decline at -59.9% while dropping to rank 6, and Watermelon Drink (100mg THC, 8oz, 237ml) fell -55.8% at rank 7; together with Blue Razzberry Drink (100mg THC, 8oz, 237ml) at -35.4% and rank 10, this signals volatility within beverages even as three beverages still sit in the top 10. Tropical Mango Drink (100mg THC, 8oz, 237ml) countered with a +73.5% surge to rank 3 versus Sour Blue Razz Gummies 2-Pack (100mg) down -25.7% at rank 1, indicating shifts in shopper trial from legacy gummies toward select beverages. Summer Melon High Dose Gummies 10-Pack (500mg) slid -22.1% at rank 9 while Enrourage - CBD/CBC/CBG/CBN/THC 1:1:1:1:1 Key Lime Gummies 10-Pack rose +33.9% at rank 4, implying potency-driven formats are ceding some share to balanced multi-cannabinoid offerings. The pattern implies Revibe is pivoting toward a barbell of one breakout beverage and functional gummy innovation while paring reliance on high-dose or flavor-only SKUs, with June 2026 mix concentration showing four of the top ten are Beverage SKUs and five are Edible SKUs.
Top Selling Cannabis Brands
Data for this report comes from real-time sales reporting by participating cannabis retailers via their point-of-sale systems, which are linked up with Headset’s business intelligence software. Headset’s data is very reliable, as it comes digitally direct from our partner retailers. However, the potential does exist for misreporting in the instance of duplicates, incorrectly classified products, inaccurate entry of products into point-of-sale systems, or even simple human error at the point of purchase. Thus, there is a slight margin of error to consider. Brands listed on this page are ranked in the top twenty within the market and product category by total retail sales volume.

