.svg)

Sep-2026
Sales
Trend
6-Month
Product Count
SKUs
Avg Price
YoY Sales Change
YoY Price Change


Where to Buy
Eden's Trees is stocked at 98 licensed dispensaries across Ohio and Pennsylvania, 61 of them in Ohio, with the deepest coverage in Columbus, Cincinnati, Akron, Athens, and Dayton. Search by ZIP code or city below to find the closest one, or filter by product type if you are after a specific format.
Market Insights Snapshot
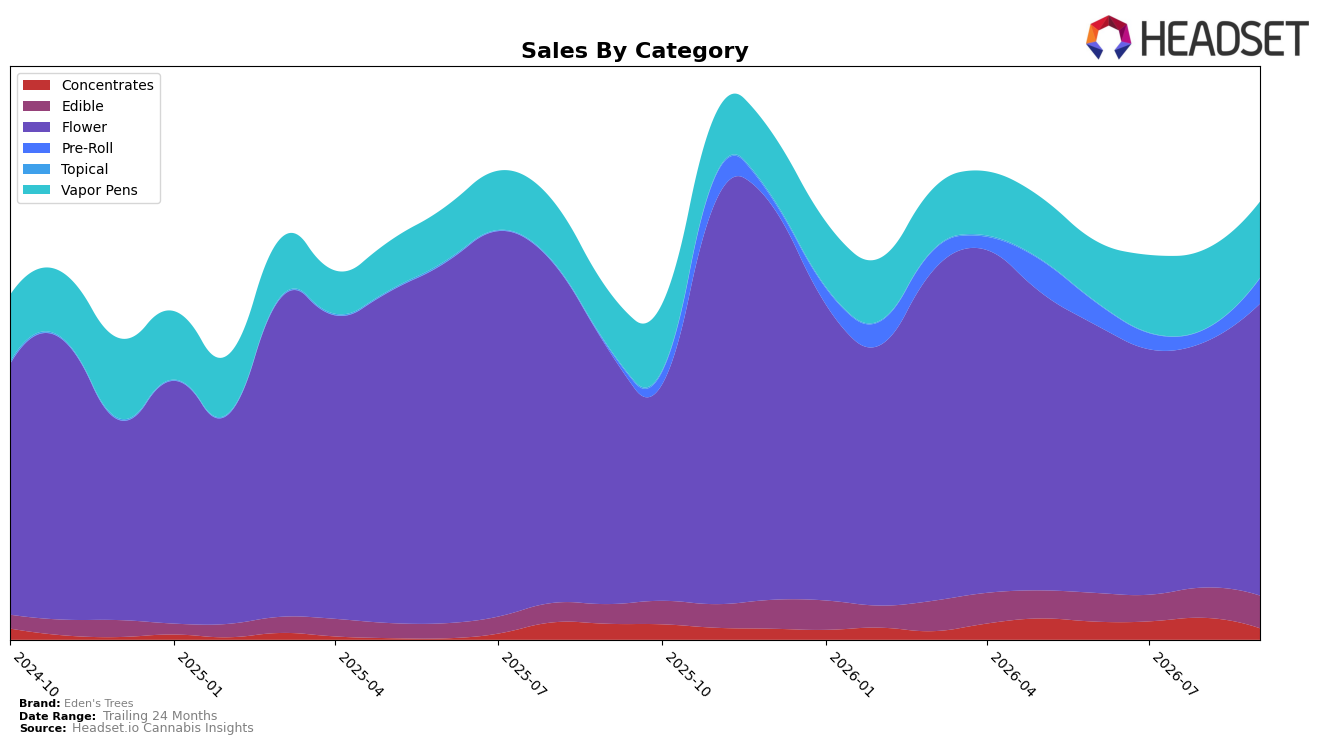
In September 2026, Eden's Trees concentrated 66.86% of sales in Flower with year-over-year growth of 14.64% and month-over-month growth of 18.95%, while Vapor Pens held 17.37% share with 36.12% YoY growth but a 4.32% MoM decline. Edible rose to 7.41% share with 67.32% YoY and 7.93% MoM gains, and Pre-Roll expanded to 5.74% share with 1540.25% YoY and 103.68% MoM growth; meanwhile, Concentrates contracted to 2.56% share with a 28.81% YoY drop and a 48.34% MoM decline, and Topical remained a 0.06% niche despite a 67.44% YoY decline and a 1262.72% MoM spike. With an average price down 18.99% YoY to $25.49 and a Flower rank of 9 in Ohio, the pattern implies deliberate price-led volume capture in core Flower while reallocating demand toward Edible and Pre-Roll to offset volatility in Concentrates.
The shift toward Edible (+67.32% YoY share growth context alongside 7.93% MoM) and the surge in Pre-Roll (+1540.25% YoY and +103.68% MoM) suggest repositioning toward accessible formats that align with the 18.99% YoY price decrease, whereas Vapor Pens’ 4.32% MoM pullback despite 36.12% YoY growth indicates sensitivity to recent pricing or assortment changes. Combined with total brand sales up 25.57% YoY but down 5.70% over 24 months, and a Flower anchor at rank 9 in Ohio, the implication is that near-term share gains are coming from value-tier expansion and format diversification, positioning Eden's Trees to trade up within Flower while using Edible and Pre-Roll as acquisition and retention levers.
Competitive Landscape
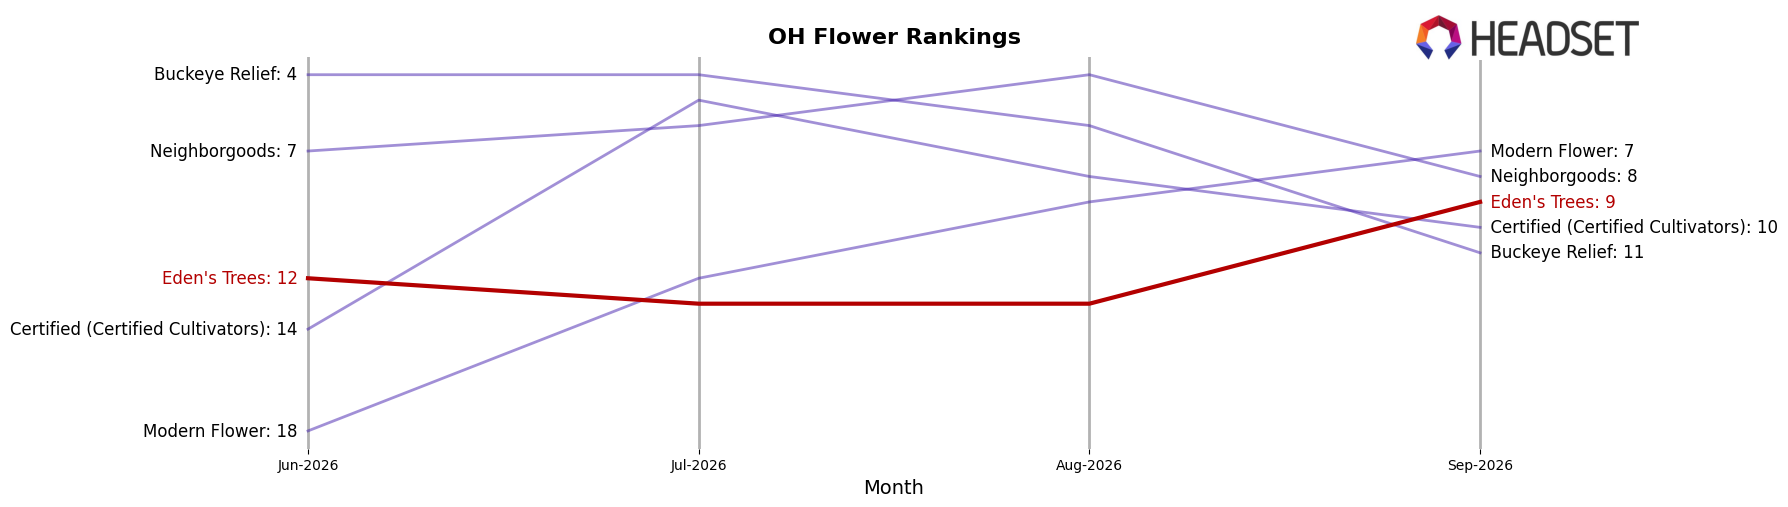
Eden's Trees sits at rank #9 in OH Flower in September 2026, a 2-position improvement from #11 year over year and a 3-position climb from #12 over the last three months; however, this trails its peak at #2 in December 2025 and lags the current #1 position held by Klutch Cannabis, which jumped from #13 to #1 with 162.4% YoY sales growth, while Riviera Creek moved from #2 to #3 amid a -1.7% YoY sales decline. Compared with RYTHM at #4 after rising from #7 with 10.4% YoY growth and Northwoods Cannabis surging to #5 from #76, Eden's Trees’ moderate rank gains without a return toward its December 2025 peak imply stabilization in mid-tier positioning rather than a trajectory back to leadership.
Notable Products
Alien Mintz (14.15g) posted the standout move in September 2026 with a 163.1% month-over-month surge and jumped into rank 3, while Alien Mintz (3.5g) held rank 1 with a modest 2.9% increase. Sherb Pop (3.5g) climbed 28.7% to rank 2 and Super Star (3.5g) rose 29.5% at rank 4, indicating that three of the top five are 3.5g Flower SKUs even as the higher-weight Flower format captured the sharpest acceleration. This mix signals a shift toward value-oriented larger formats pulling volume upside, while classic 3.5g leaders maintain rank-based stability that anchors the lineup.
Top Selling Cannabis Brands






Data for this report comes from real-time sales reporting by participating cannabis retailers via their point-of-sale systems, which are linked up with Headset’s business intelligence software. Headset’s data is very reliable, as it comes digitally direct from our partner retailers. However, the potential does exist for misreporting in the instance of duplicates, incorrectly classified products, inaccurate entry of products into point-of-sale systems, or even simple human error at the point of purchase. Thus, there is a slight margin of error to consider. Brands listed on this page are ranked in the top twenty within the market and product category by total retail sales volume.

