.svg)

Sep-2026
Sales
Trend
6-Month
Product Count
SKUs
Avg Price
YoY Sales Change
YoY Price Change


Where to Buy
Revival is stocked at 35 licensed dispensaries across New York, with the deepest coverage in Rochester, Buffalo, Jamestown, Syracuse, and Airmont. Search by ZIP code or city below to find the closest one, or filter by product type if you are after a specific format.
Market Insights Snapshot
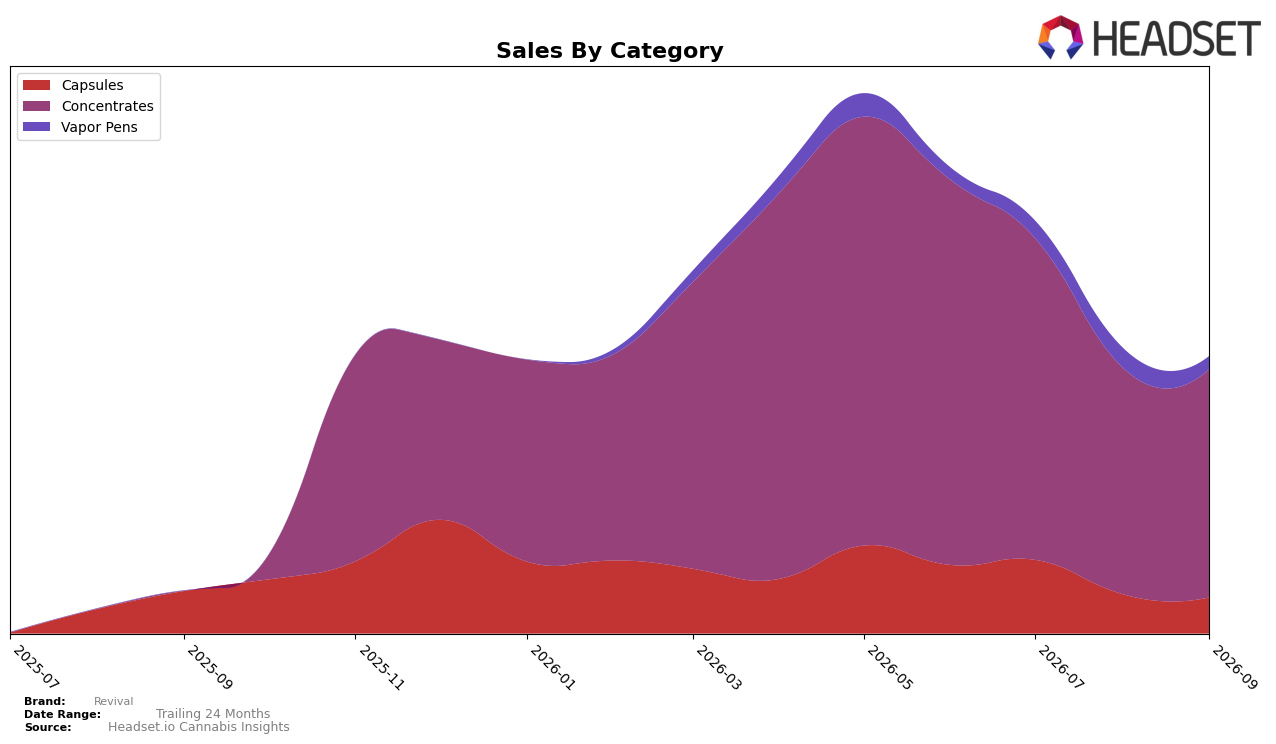
Revival’s September 2026 mix is concentrated in Concentrates at 82.45% share with a 0.67% MoM increase, while Capsules hold 12.96% share with a -8.53% MoM decline and -15.12% YoY contraction; Vapor Pens account for 4.59% share with a -35.30% MoM drop. Average price rose 34.24% YoY to $36.04 as Concentrates averaged $39.95 and Vapor Pens $37.59, alongside brand sales up 554.91% YoY; within Concentrates in New York, Revival sits at rank 37. The pattern indicates reliance on a single category for scale and pricing power, with share gains in Concentrates offsetting contraction in Capsules and sharp MoM weakness in Vapor Pens.
With Concentrates at 82.45% share and a rank of 37 in New York, the 0.67% MoM growth there contrasts with a -35.30% MoM slide in Vapor Pens and a -15.12% YoY decline in Capsules, implying a positioning anchored to extract-driven buyers rather than format diversification. The 34.24% YoY price lift paired with 554.91% YoY sales growth suggests demand tolerance for premiumized Concentrates, while the shrinking Capsules and Vapor Pens shares signal a trade-up dynamic toward Concentrates rather than cross-format expansion.
Competitive Landscape
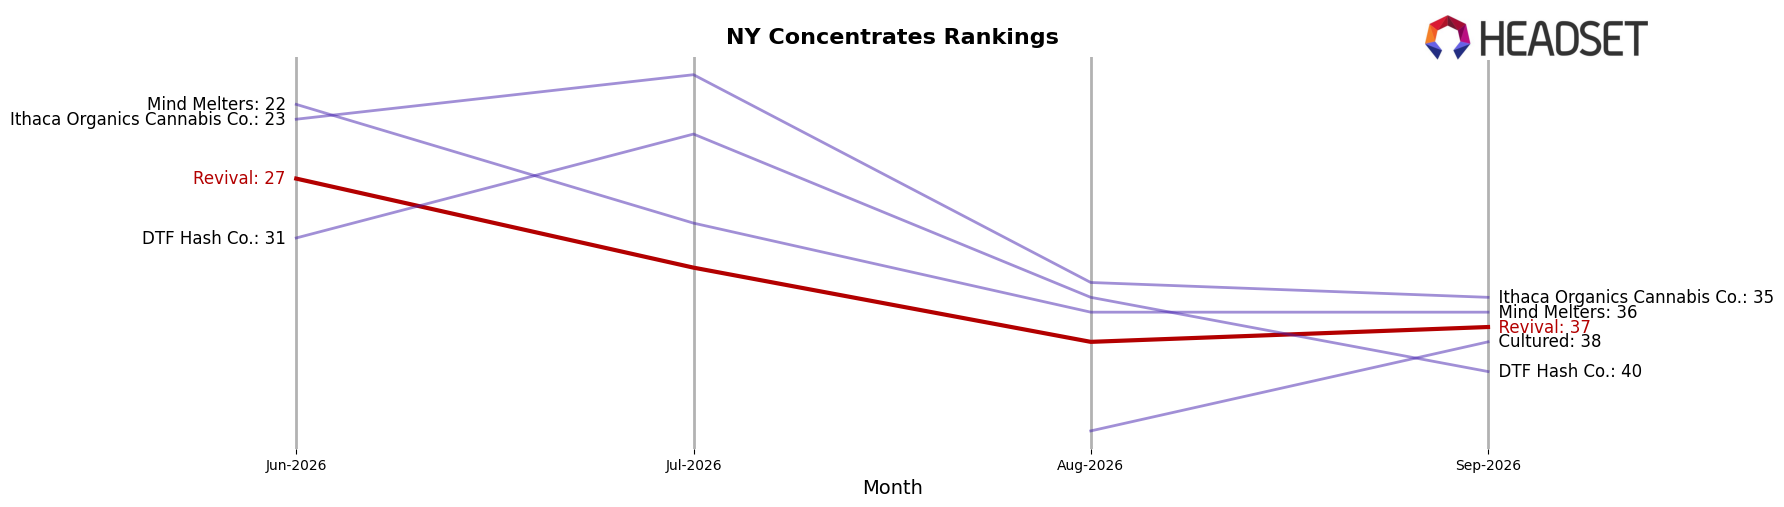
Revival sits at rank #37 in New York Concentrates in September 2026, down 10 positions from #27 in June 2026 and 10 positions from #27 in July 2026, while June 2026 also marked its peak rank at #27 with a subsequent 37% drop in rank position density relative to the top 30. In contrast, Mfny (Marijuana Farms New York) held #1 with a 43.7% year-over-year sales increase and RYTHM advanced to #2 from #4 alongside a 43.7% YoY lift, whereas Jetpacks slipped to #3 from #2 with an 8.0% YoY decline. The combination of a 10-rank slide since June 2026 and competitor gains of 43.7% YoY at the top implies Revival’s trajectory is one of share compression unless it reverses the rank erosion against faster-rising leaders.
Notable Products
Papaya Bomb Live Hash Rosin (1g) posted the standout move with a 97.98% month-over-month surge to rank 2, while Superboof Cold Cured Live Hash Rosin (1g) climbed 56.55% to rank 1. In contrast, Power Plant Live Hash Rosin (1g) fell 41.53% and Power Plant Cold Cured Live Hash Rosin (1g) dropped 31.28% to rank 10, indicating a sharp intra-category divergence. Three of the top four SKUs are Concentrates and two carry the Papaya Bomb lineage across formats, implying Revival’s momentum is consolidating around fewer terpene-forward rosin variants even as weaker strain SKUs are being de-emphasized.
Top Selling Cannabis Brands






Data for this report comes from real-time sales reporting by participating cannabis retailers via their point-of-sale systems, which are linked up with Headset’s business intelligence software. Headset’s data is very reliable, as it comes digitally direct from our partner retailers. However, the potential does exist for misreporting in the instance of duplicates, incorrectly classified products, inaccurate entry of products into point-of-sale systems, or even simple human error at the point of purchase. Thus, there is a slight margin of error to consider. Brands listed on this page are ranked in the top twenty within the market and product category by total retail sales volume.

