.svg)

Sep-2026
Sales
Trend
6-Month
Product Count
SKUs
Avg Price
YoY Sales Change
YoY Price Change


Where to Buy
Vireo is stocked at 47 licensed dispensaries across New York, Minnesota, and Maryland, 30 of them in New York, with the deepest coverage in New York, Cheektowaga, Albany, Buffalo, and Clifton Park. Search by ZIP code or city below to find the closest one, or filter by product type if you are after a specific format.
Market Insights Snapshot
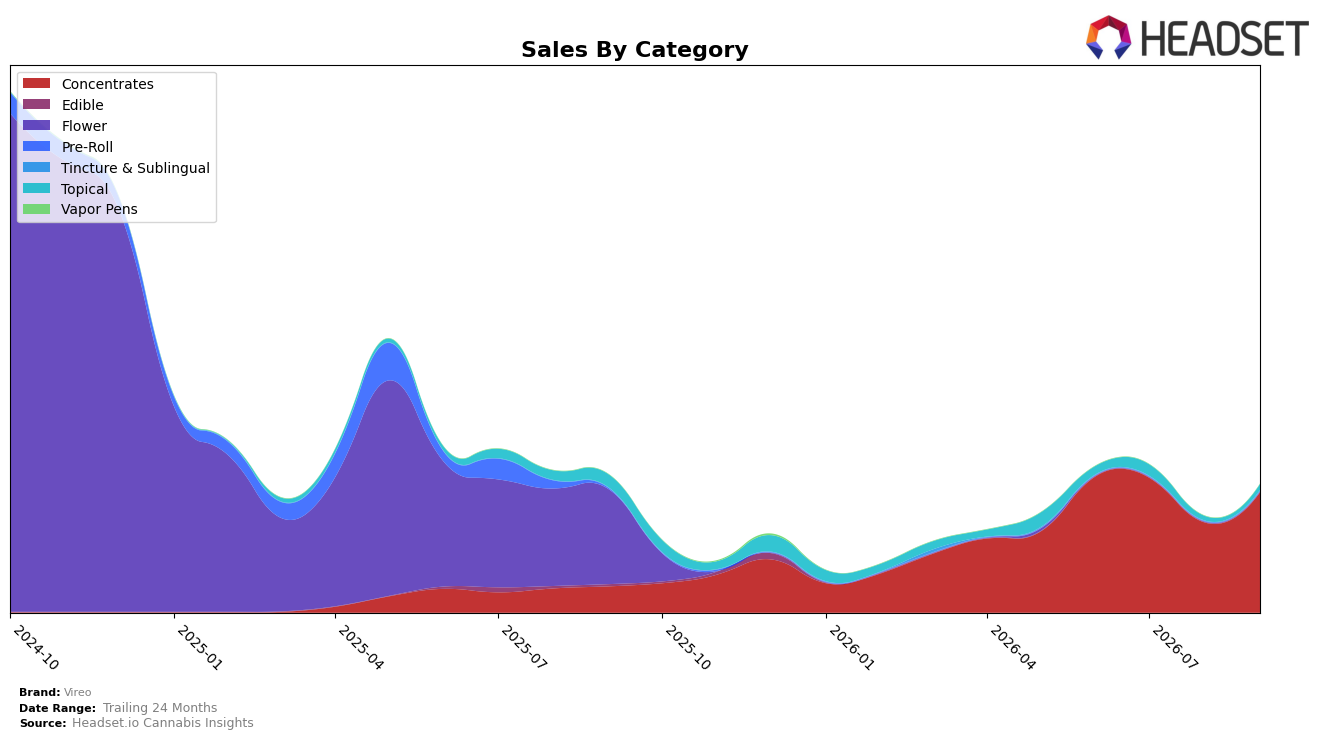
Vireo’s September 2026 mix is overwhelmingly Concentrates at 95.39% share, up 33.59% month over month and 362.55% year over year, while Topical sits at 4.33% share with a 31.68% MoM rise but a 56.66% YoY decline; Tincture & Sublingual holds just 0.28% share with no comparable YoY or MoM data. Despite a brand-level sales decline of 7.35% YoY and a 24‑month drop of 38.34%, the category tilt toward Concentrates coincides with an 82.69% YoY lift in average price and a rank of 23 in Concentrates in New York, indicating a strategic concentration into a single format where rank traction can be monitored against price moves.
The September 2026 shift concentrates revenue risk and pricing power into Concentrates, where a 95.39% share and 33.59% MoM growth create sensitivity to any reversal, while Topical’s 56.66% YoY sales contraction alongside a 31.68% MoM uptick hints at tactical promotions rather than structural recovery. With average price up 82.69% YoY against a brand-level sales decline of 7.35% YoY and a Concentrates rank of 23 in New York, the pattern implies Vireo is trading unit volume for higher price in a narrow category footprint, anchoring positioning on premiumized Concentrates while deprioritizing breadth.
Competitive Landscape
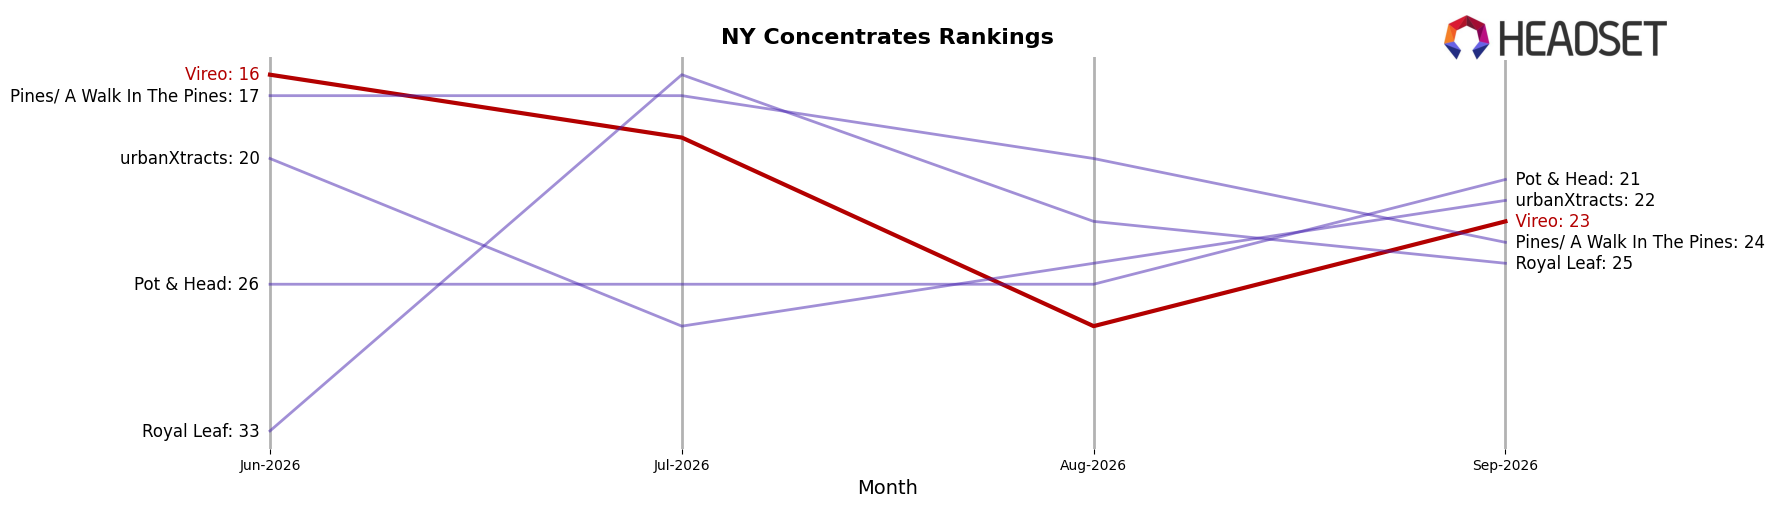
Vireo ranks #23 in New York Concentrates in September 2026, improving 12 positions year over year from #35, but slipping 7 spots since June 2026 when it peaked at #16; this contrasts with Mfny (Marijuana Farms New York) holding #1 with a 43.7% year-over-year sales increase and UMAMII climbing from #21 to #4 alongside 680.1% year-over-year growth. While Vireo’s three-month drop from #16 to #23 suggests short-term share loss against faster-rising rivals, the year-over-year climb from #35 indicates a recovery trajectory that implies Vireo must regain mid-year momentum to avoid further displacement by ascendant competitors.
Notable Products
CBD/THC 1:19 Indigo Balm (5mg CBD, 95mg THC, 1.5oz) posted the largest month-over-month jump at 156.25% while entering September 2026 tied at rank 5, and CBD/THC 1:1 Green Balm (50mg CBD, 50mg THC, 1.5oz) fell 11.96% to rank 5, marking a split trajectory within Topicals. Indica RSO Syringe (1g) surged 60.49% to rank 2 as Sativa RSO Syringe (1g) gained 47.28% to hold rank 1, and Hybrid RSO Syringe (1g) slipped 4.22% at rank 3, signaling sustained pull toward the RSO sub-line despite one variant softening. With three RSO syringes occupying ranks 1–3 and multiple Topicals in the top five, the mix indicates a pivot toward high-potency concentrates and targeted wellness formats, with September 2026 revenue concentration skewing to RSO while Topicals reaccelerate off a low base and broaden the basket at approximately $17,095 in sales for the Sativa RSO Syringe (1g).
Top Selling Cannabis Brands






Data for this report comes from real-time sales reporting by participating cannabis retailers via their point-of-sale systems, which are linked up with Headset’s business intelligence software. Headset’s data is very reliable, as it comes digitally direct from our partner retailers. However, the potential does exist for misreporting in the instance of duplicates, incorrectly classified products, inaccurate entry of products into point-of-sale systems, or even simple human error at the point of purchase. Thus, there is a slight margin of error to consider. Brands listed on this page are ranked in the top twenty within the market and product category by total retail sales volume.

