Market Insights Snapshot
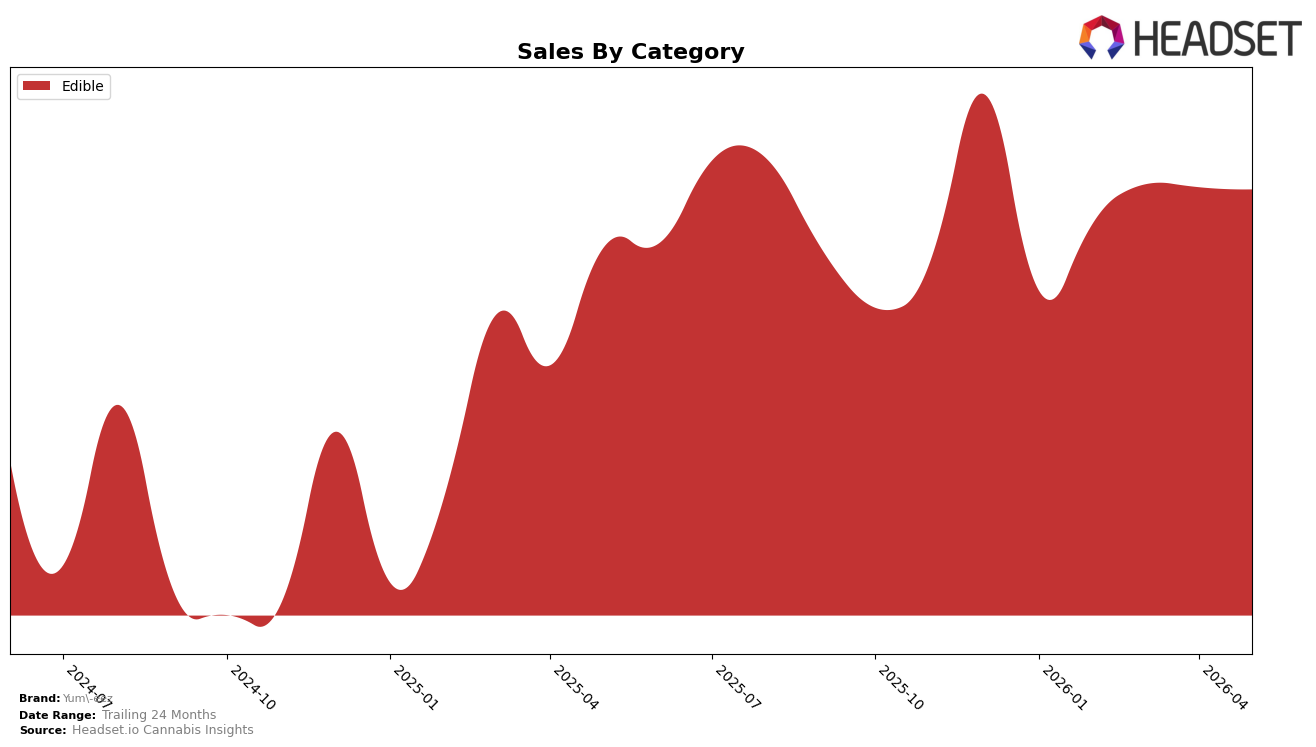
In May 2026, Yum-eez operated as a single-category brand with Edible accounting for 100.0% of sales, pairing a year-over-year sales change of 10.8% with a month-over-month decline of 0.37%. Average price rose 18.7% year over year to $14.17 while unit momentum softened alongside the MoM dip, and the Edible rank in Missouri sat at position 22 within Edible. The pattern implies price-led growth is outpacing unit traction, concentrating risk in a one-category footprint that sits mid-pack at rank 22.
The mix concentration at 100.0% in Edible, combined with a 10.8% YoY sales increase versus a -0.37% MoM step-down, suggests Yum-eez is riding annual pricing gains while near-term velocity cools, which can widen volatility if Edible demand softens. With average price up 18.7% YoY and the current rank at 22 in Missouri, the brand’s positioning skews toward value capture over share capture; to improve rank, the implication is to convert price strength into sustained unit growth or selectively diversify beyond a 100.0% Edible mix.
Competitive Landscape
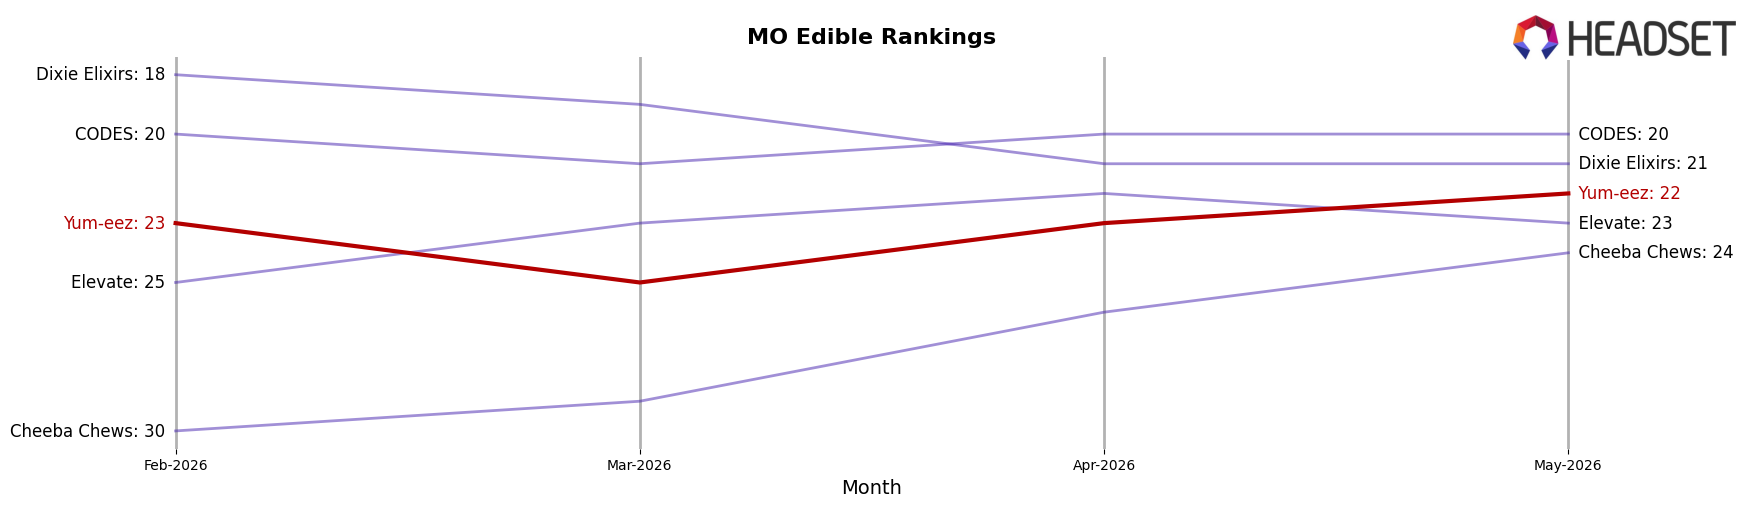
Yum-eez sits at rank #22 in MO Edible in May 2026, improving 6 positions from #28 year over year, while slipping 1 spot from #23 three months ago; this puts its current rank equal to its peak at #22 in May 2026 and signals a climb over 21 other brands YoY despite a recent one-position quarterly softening. In the competitive set, Gron / Grön held #1 both this year and last year even as its sales fell 14.1% YoY, and Good Day Farm moved up from #3 to #2 with an 8.7% YoY sales increase; against that backdrop, Yum-eez’s upward rank shift of 6 places YoY, coupled with a 1-place three-month dip, implies share is being won incrementally but momentum remains fragile if near-term execution wavers.
Notable Products
Indica Pineapple Gummies 10-Pack (120mg) posted the steepest move in May 2026 at -26.55% MoM while sliding to rank 6, contrasted by Sativa Sour Green Apple Gummies 10-Pack (250mg) up 17.26% at rank 2; nine of the top ten are Edible SKUs, signaling consolidation in a single format. Sativa Mango Gummies 10-Pack (100mg) surged 73.43% MoM into rank 1, while Hybrid Blackberry Gummies 10-Pack (100mg) fell 15.59% to rank 8, indicating a tilt toward Sativa-led gains over Hybrid and select Indica variants. Indica Pineapple Gummies 10-Pack (250mg) rose 10.21% to rank 5 as the 120mg sibling declined, implying dose-tier substitution within the same flavor line. The mix points to Yum-eez prioritizing higher-dose or Sativa-forward gummies to capture momentum while pruning underperforming lower-dose variants to reduce cannibalization.
Top Selling Cannabis Brands
Data for this report comes from real-time sales reporting by participating cannabis retailers via their point-of-sale systems, which are linked up with Headset’s business intelligence software. Headset’s data is very reliable, as it comes digitally direct from our partner retailers. However, the potential does exist for misreporting in the instance of duplicates, incorrectly classified products, inaccurate entry of products into point-of-sale systems, or even simple human error at the point of purchase. Thus, there is a slight margin of error to consider. Brands listed on this page are ranked in the top twenty within the market and product category by total retail sales volume.

