.svg)
Sep-2026
Sales
Trend
6-Month
Product Count
SKUs
Avg Price
YoY Sales Change
YoY Price Change


Where to Buy
Rochester Farms is stocked at 55 licensed dispensaries across Washington and Oklahoma, 54 of them in Washington, with the deepest coverage in Tacoma, Olympia, Everett, Seattle, and Auburn. Search by ZIP code or city below to find the closest one, or filter by product type if you are after a specific format.
Market Insights Snapshot
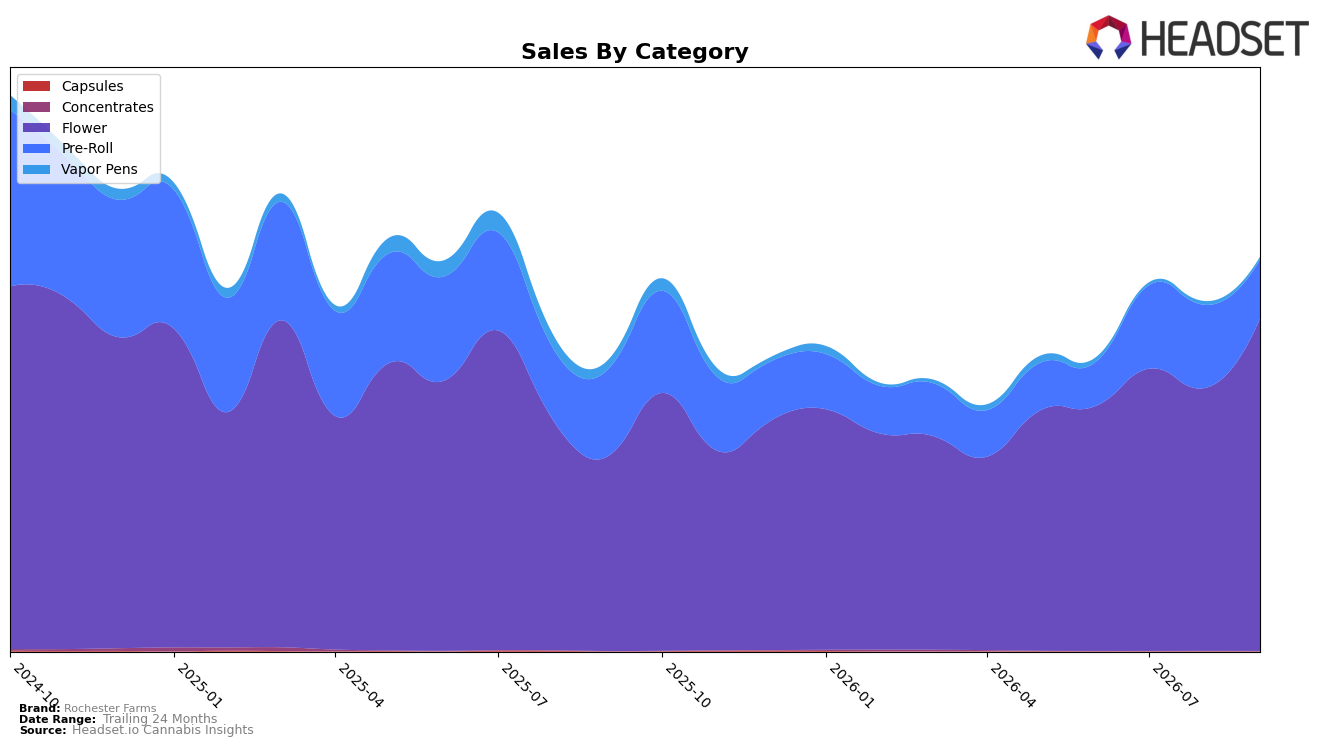
In September 2026, Rochester Farms concentrated 84.47% of sales in Flower with year-over-year growth of 70.62% and month-over-month growth of 26.54%, while Pre-Roll fell to a 14.88% share with a -32.43% YoY decline and a -29.41% MoM drop. Vapor Pens contracted to 0.64% share with -72.04% YoY and -26.26% MoM, and Capsules slipped MoM by -62.61% off a negligible 0.01% share. Despite a 35.47% YoY lift for the overall brand and a 36.68% YoY increase in average price, the two-year trend remains -24.77%, indicating that the current upswing is narrowly driven by Flower while other formats retreat. The pattern implies that Rochester Farms is leaning into Flower in Washington at a time when category breadth is thinning, which concentrates risk and price exposure in a single format.
With Flower ranked 49th in Washington Flower and holding 84.47% of mix, the 26.54% MoM surge in Flower alongside a -29.41% MoM drop in Pre-Roll suggests Rochester Farms is trading variety for depth, prioritizing higher-priced Flower (average $20.43 overall, $26.95 in Flower) while ceding presence in lower-priced or convenience formats. The -72.04% YoY collapse in Vapor Pens and -32.43% YoY in Pre-Roll, contrasted with 70.62% YoY in Flower, indicates positioning anchored to traditional inhalables rather than cross-format coverage. The implication is that market share gains must come from Flower velocity and price realization, not portfolio width, which can cap discovery and make the 49th-place Flower rank a ceiling unless secondary categories stabilize.
Competitive Landscape
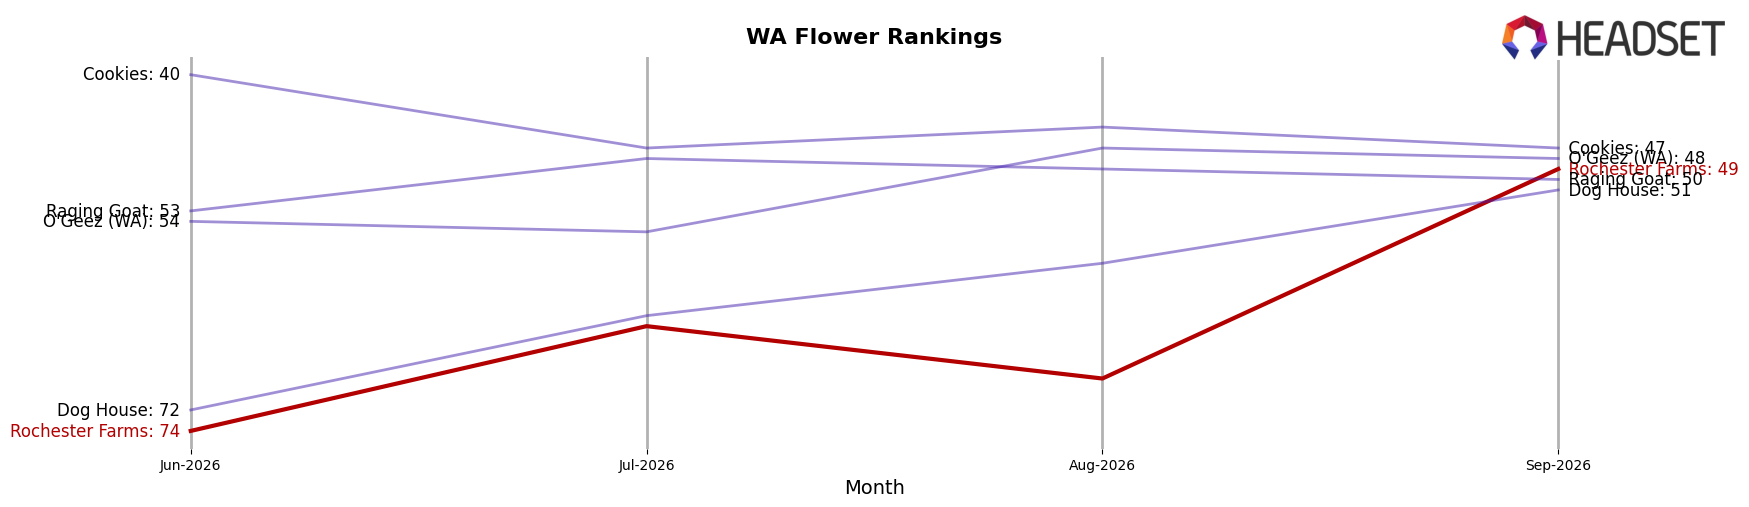
Rochester Farms sits at rank #49 in WA Flower in September 2026, improving 42 positions YoY from #91 and climbing 25 spots since June 2026 from #74, while also marking a peak rank of #49 in September 2026; in contrast, Phat Panda held #1 both YoY and currently with sales up 19.0% YoY, and Hemp Kings surged from #24 YoY to #5 with 105.1% YoY sales growth. Given this leap from the 90s into the top 50 alongside a three-month gain of 25 ranks, the pattern implies Rochester Farms has transitioned from peripheral presence to mid-pack relevance, but future share will hinge on sustaining multi-month momentum against incumbents moving up the ladder.
Notable Products
Purple Punch (3.5g) posted the standout move in September 2026 with a 118.1% month-over-month surge to rank 1, while Gorilla Glue #4 Pre-Roll 2-Pack (1g) slipped 10.2% to rank 8, indicating momentum is consolidating at the top even as tail SKUs soften. Pink Lemonaid (3.5g) climbed 96.9% to rank 2, and with four of the top ten in the Flower category occupying ranks 1, 2, 3, and 4, the mix is skewing toward higher-turn Flower units over Pre-Rolls. With Blueberry Muffin (3.5g) up 16.4% at rank 4 and only one visible decline in the top ten, the pattern implies Rochester Farms is concentrating sell-through in a few accelerating Flower SKUs while allowing lower-ranked Pre-Rolls to recede.
Top Selling Cannabis Brands






Data for this report comes from real-time sales reporting by participating cannabis retailers via their point-of-sale systems, which are linked up with Headset’s business intelligence software. Headset’s data is very reliable, as it comes digitally direct from our partner retailers. However, the potential does exist for misreporting in the instance of duplicates, incorrectly classified products, inaccurate entry of products into point-of-sale systems, or even simple human error at the point of purchase. Thus, there is a slight margin of error to consider. Brands listed on this page are ranked in the top twenty within the market and product category by total retail sales volume.

