Jun-2026
Sales
Trend
6-Month
Product Count
SKUs
Avg Price
YoY Sales Change
YoY Price Change
Market Insights Snapshot
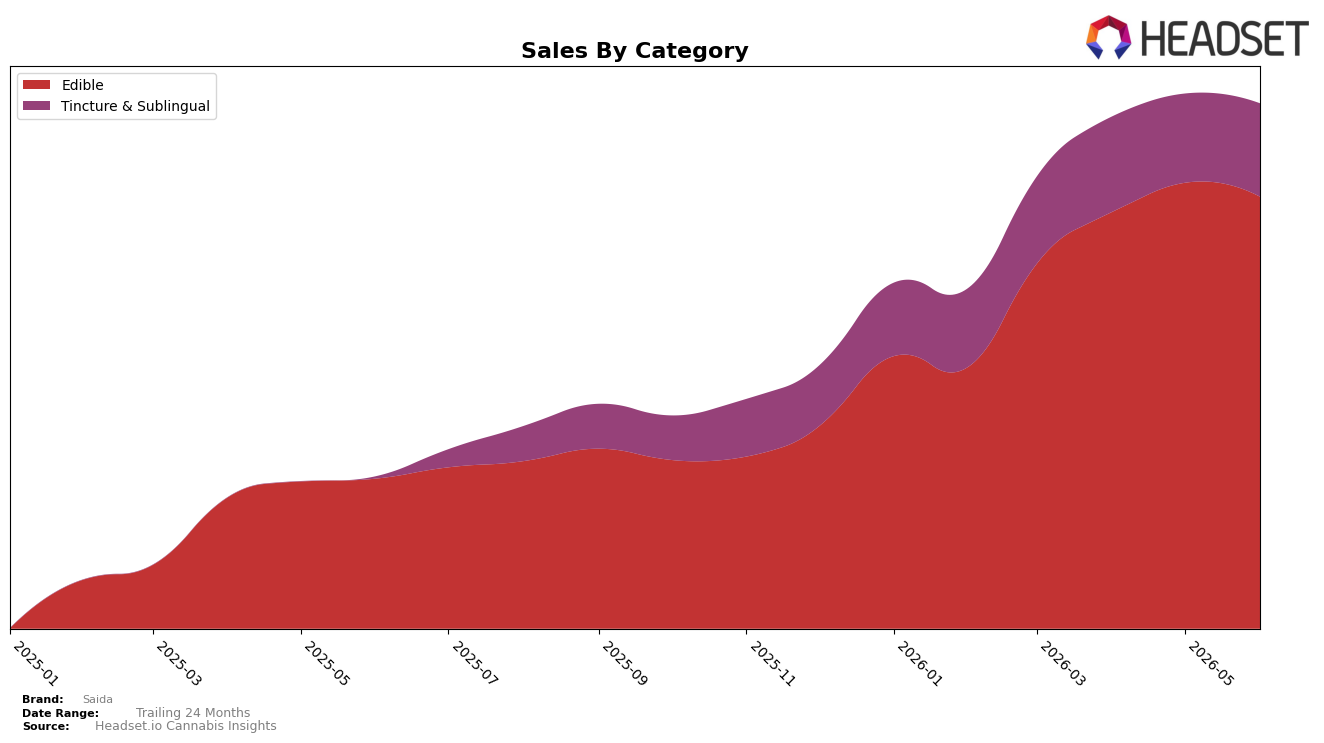
In June 2026, Saida concentrated 82.27% of sales in Edible while Tincture & Sublingual held 17.73%, with Edible down 3.13% month over month but up 188.33% year over year; by contrast, Tincture & Sublingual rose 4.69% month over month and 4,627.44% year over year. The brand’s average price rose 31.81% year over year to $5.87 while the Edible average price sat at 5.09, and Tincture & Sublingual commanded 20.57; paired with a rank of 16 in Edible within California, this tilt implies Saida is monetizing a premium-led extension without displacing its Edible base, positioning the mix for higher revenue density even as the Edible share remains dominant.
The category reweighting—down 3.13% MoM in Edible against a 4.69% MoM gain in Tincture & Sublingual and a 4,627.44% YoY surge—suggests Saida is using Tincture & Sublingual as a growth wedge to hedge seasonality and price ceilings in Edible. Holding 82.27% share in Edible while ranking 16 in California indicates headroom: if Tincture & Sublingual sustains even a fraction of its 4,627.44% YoY trajectory while Edible maintains a 188.33% YoY clip, Saida’s positioning shifts from a single-category volume play toward a two-category stack where higher ticket sizes in Tincture & Sublingual support margin while Edible preserves scale.
Competitive Landscape
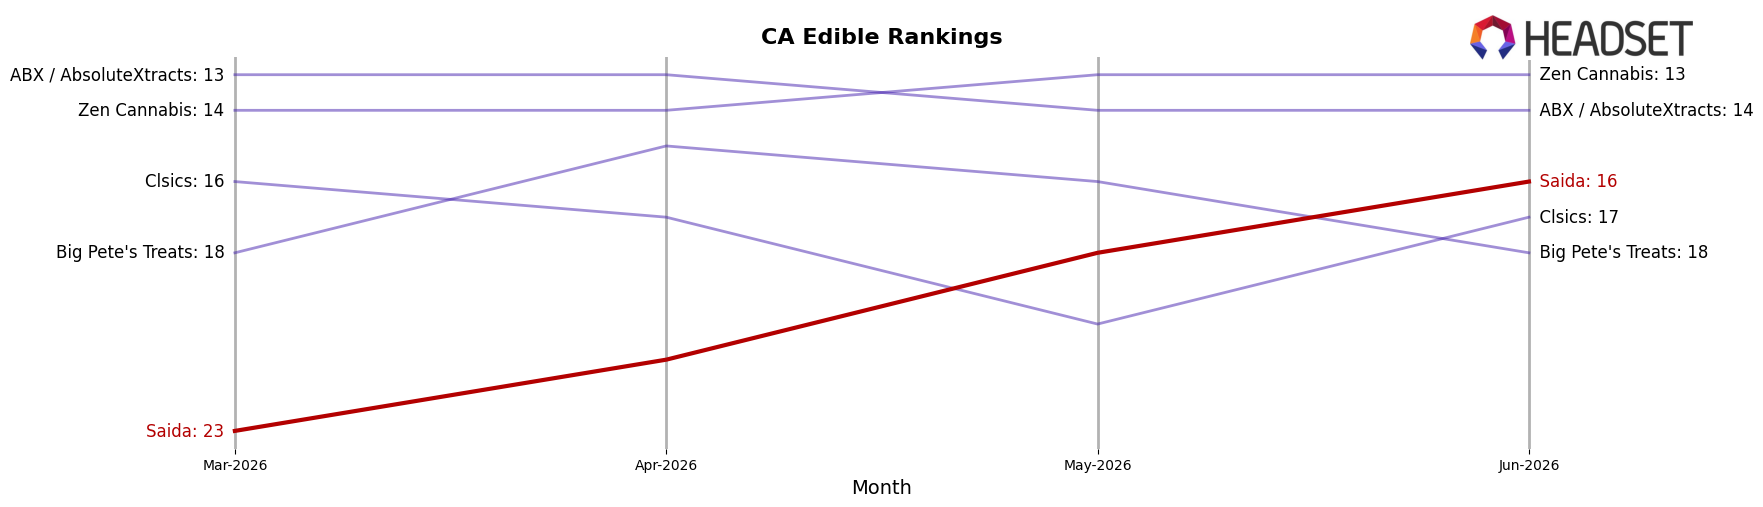
Saida is ranked #16 in CA Edible in June 2026, improving 15 positions year over year from #31, and climbing 7 spots since March 2026 when it sat at #23; by contrast, Wyld held steady at #1 with a -1.9% YoY sales change while Camino maintained #2 with +12.9% YoY growth. Saida’s current #16 also marks its peak rank in June 2026, whereas Kanha / Sunderstorm remained fixed at #3 with +10.9% YoY growth and Good Tide stayed at #5 with +28.5% YoY growth, indicating that Saida’s share gains are coming from movement in the mid-tier rather than displacing the top five; the rank trajectory implies Saida is transitioning from lower-tier presence toward a stable mid-pack position that requires further step-changes to penetrate the top 10.
Notable Products
Summer Watermelon Gummies Bar 10-Pack (100mg) posted the steepest decline in June 2026 with a -22.5% month-over-month change and slid to rank 7, while Tropical Blue Razz Gummy (100mg) held rank 1 despite a -4.8% dip. Rainbow Sherbet Gummies 10-Pack (100mg) fell -12.3% at rank 3 versus Berry Citrus Rocky Rope Gummy (100mg) rising 6.2% at rank 2, and the CBN/THC 1:10 Sleepy Berry Gummies 10-Pack advanced 30.7% to rank 8. Nine of the top ten SKUs are Edibles, and Tincture & Sublingual appears only once at rank 9 with a 12.4% lift and approximately $20,365 in sales. The pattern implies Saida’s mix is consolidating around Edible gummies with selective functional variants gaining traction while flavor-led SKUs face sharper volatility, guiding assortment toward fewer, clearer winners.
Top Selling Cannabis Brands
Data for this report comes from real-time sales reporting by participating cannabis retailers via their point-of-sale systems, which are linked up with Headset’s business intelligence software. Headset’s data is very reliable, as it comes digitally direct from our partner retailers. However, the potential does exist for misreporting in the instance of duplicates, incorrectly classified products, inaccurate entry of products into point-of-sale systems, or even simple human error at the point of purchase. Thus, there is a slight margin of error to consider. Brands listed on this page are ranked in the top twenty within the market and product category by total retail sales volume.

