.svg)
Aug-2026
Sales
Trend
6-Month
Product Count
SKUs
Avg Price
YoY Sales Change
YoY Price Change


Where to Buy
Lights Out is stocked at 12 licensed dispensaries across California and Rhode Island, 11 of them in California, with the deepest coverage in San Diego, La Mesa, Chula Vista, Encinitas, and Lemon Grove. Search by ZIP code or city below to find the closest one, or filter by product type if you are after a specific format.
Market Insights Snapshot
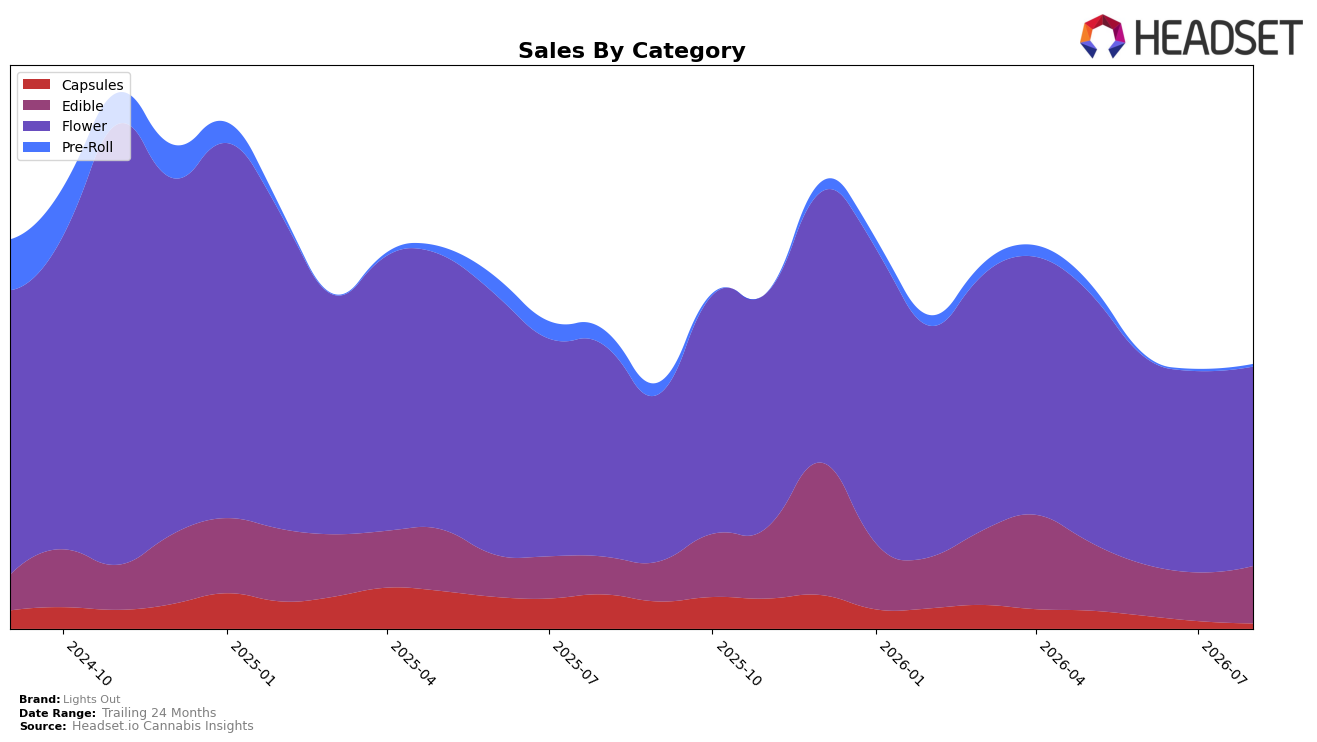
In August 2026, Lights Out concentrated 74.01% of sales in Flower, where year-over-year declined 5.64% and month-over-month slipped 0.91%, while Edible expanded to 21.74% share with year-over-year up 49.65% and month-over-month up 17.24%. Smaller lines diverged: Capsules fell 80.14% year-over-year and 24.33% month-over-month to 2.64% share, whereas Pre-Roll, at 1.61% share, remained down 74.50% year-over-year but ticked up 10.96% month-over-month. With brand sales down 11.17% year-over-year and average price down 14.84%, the mix shift toward Edible amid Flower softness implies a pivot from a single-category anchor to a more balanced portfolio that relies on Edible growth to offset declines in Capsules and Flower.
These shifts point to a positioning recalibration: Flower still defines shelf identity but a 69 rank in Flower in California and a 5.64% year-over-year decline suggest limited headroom, while Edible’s 49.65% year-over-year and 17.24% month-over-month gains indicate a traction lane where pricing and velocity can be tuned without overexposure to Flower’s 0.91% month-over-month dip. The combination of a 14.84% average price decrease and growing Edible share at 21.74% implies Lights Out is trading some premium for volume in value-oriented formats, with Capsules’ 80.14% year-over-year contraction and Pre-Roll’s 74.50% year-over-year drop reinforcing the need to prioritize Edible and stabilize Flower to sustain base visibility while avoiding further dilution from underperforming micro-lines.
Competitive Landscape
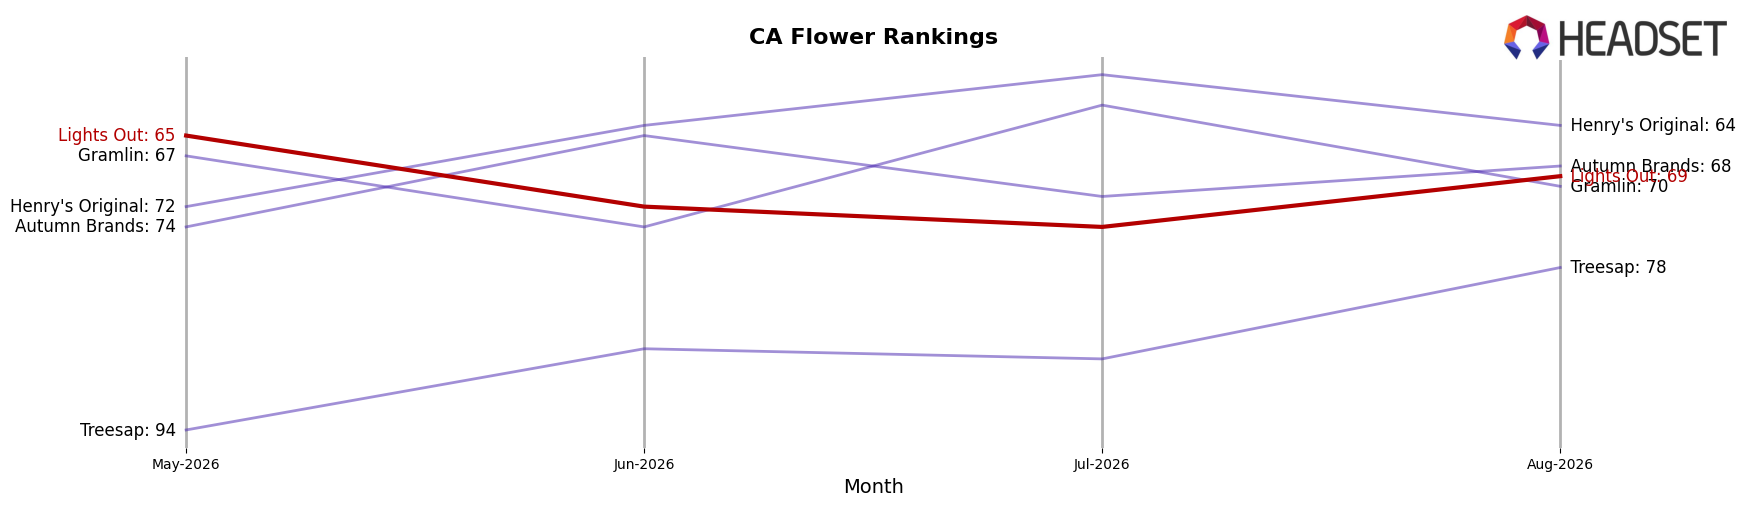
Lights Out sits at rank 69 in CA Flower for August 2026, improving 5 positions from rank 74 year over year, yet slipping 4 spots from rank 65 in May 2026; against its historical ceiling at rank 44 in November 2024, the current placement is 25 ranks off that peak, while the top of the table tightened as STIIIZY advanced from rank 2 to rank 1 and CAM climbed from rank 3 to rank 2 with sales up 46.6%, contrasting with CannaBiotix (CBX) dropping from rank 1 to rank 3 alongside a 16.0% sales decline; this mix of a modest YoY rank gain and recent quarter slippage implies Lights Out is stabilizing but not converting that stability into sustained ascent in a market where leaders are widening distance.
Notable Products
Pink Acai (3.5g) posted the steepest decline at -26.6% while sitting at rank 3, and Saturn OG (3.5g) held rank 1 with a +33.9% MoM lift, indicating a bifurcation within Flower where share is consolidating to the leader. Sativa Pineapple Live Rosin Gummies 10-Pack (100mg) climbed +36.0% at rank 4 as Orange Live Rosin Gummies 10-Pack (100mg) added +20.8% at rank 8, and five of the top ten are Edible SKUs, which signals a rising contribution from Live Rosin formats even as Flower anchors the leaderboard. THC/CBN/CBD 1:1:1 Wildberry Deep Sleep Gummies 10-Pack (100mg THC, 100mg CBN, 100mg CBD) slipped -5.3% at rank 2 while the THC/CBD/CBN 1:1:1 Kiwi Live Rosin Gummies 10-Pack (50mg THC, 50mg CBD, 50mg CBN) was nearly flat at -0.1% at rank 9, suggesting functional blends are holding placement but not accelerating. The mix implies Lights Out is tilting toward a two-engine portfolio where a single flagship Flower SKU concentrates volume—$154,022 in August 2026—while diversified Live Rosin Edibles broaden reach without yet displacing Flower at the top.
Top Selling Cannabis Brands






Data for this report comes from real-time sales reporting by participating cannabis retailers via their point-of-sale systems, which are linked up with Headset’s business intelligence software. Headset’s data is very reliable, as it comes digitally direct from our partner retailers. However, the potential does exist for misreporting in the instance of duplicates, incorrectly classified products, inaccurate entry of products into point-of-sale systems, or even simple human error at the point of purchase. Thus, there is a slight margin of error to consider. Brands listed on this page are ranked in the top twenty within the market and product category by total retail sales volume.

