.svg)

Sep-2026
Sales
Trend
6-Month
Product Count
SKUs
Avg Price
YoY Sales Change
YoY Price Change


Where to Buy
Seattle Bubble Works is stocked at 102 licensed dispensaries across Washington, with the deepest coverage in Seattle, Olympia, Vancouver, Bellingham, and Everett. Search by ZIP code or city below to find the closest one, or filter by product type if you are after a specific format.
Market Insights Snapshot
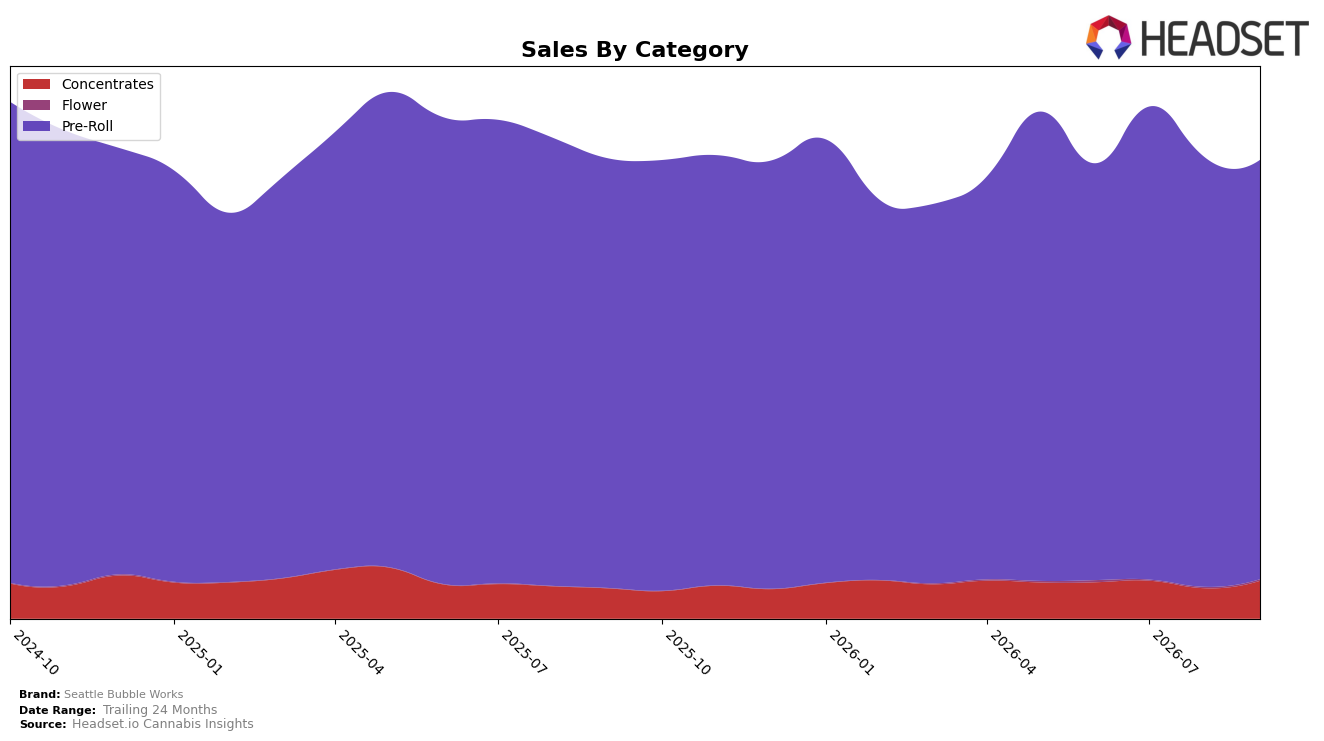
In September 2026, Seattle Bubble Works concentrated 91.55% of sales in Pre-Roll, where sales declined 2.39% year over year and 2.40% month over month, while maintaining an average price of $7.51 and an overall brand average price down 16.29% YoY. Concentrates expanded to an 8.20% share with sales up 25.39% YoY and 24.57% MoM, and Flower, though only 0.25% share, gained 22.25% MoM off a small base. With an 8th-place rank in Pre-Roll in Washington and brand sales down 33.16% YoY despite a 3.45% 24‑month increase, the category mix indicates dependency risk in Pre-Roll and an early diversification pivot via Concentrates.
The combination of a 2.39% YoY decline in the 91.55% Pre-Roll core and a 25.39% YoY surge in the 8.20% Concentrates slice implies a margin and volume rebalancing strategy that trades breadth for stability; the 2.40% MoM dip in Pre-Roll alongside a 24.57% MoM rise in Concentrates suggests near-term cannibalization rather than net expansion. Given an 8th-place standing in Washington Pre-Roll and a 16.29% YoY drop in average price, the mix shift implies Seattle Bubble Works is positioning to reduce price pressure in Pre-Roll by cultivating a higher-price Concentrates beachhead while testing Flower as an option value, aiming to stabilize share without overextending in a rank-constrained core.
Competitive Landscape
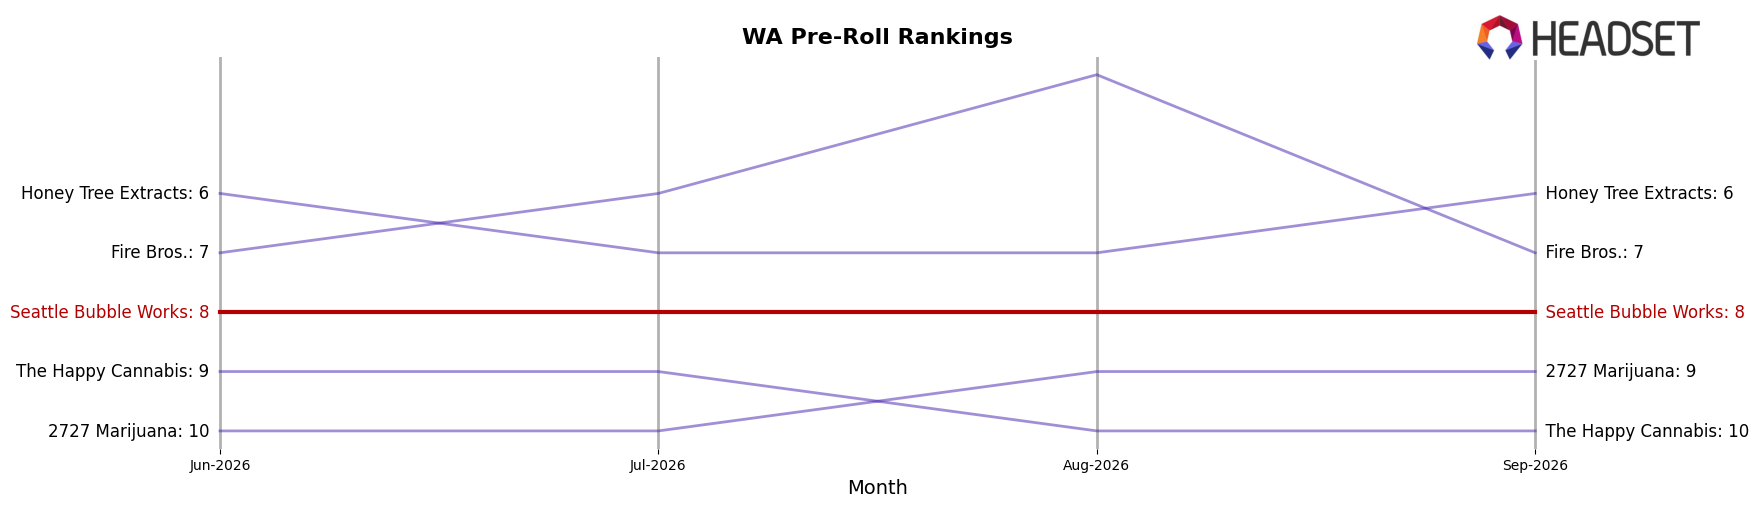
Seattle Bubble Works sits at rank #8 in WA Pre-Roll for September 2026, down 1 position year over year from #7, while holding flat versus June 2026 at #8 and still trailing its peak of #6 from May 2026; meanwhile, Ooowee held #1 year over year with a 57.7% YoY sales lift and Lifted Cannabis Co moved up from #5 to #4 as Stingers slipped from #4 to #5 with a 9.2% YoY increase, indicating the competitive window is tightening above Seattle Bubble Works despite only a one-rank YoY decline; this mix of a 1-place YoY drop and a 2-place gap to the May 2026 peak implies stalled momentum that risks entrenchment in the second tier unless share recapture accelerates against rivals gaining rank.
Notable Products
Granddaddy Purple Hash Infused Pre-Roll 10-Pack (5g) posted the steepest decline at -10.1% month over month while slipping to rank 5, whereas Bubba Kush Hash Infused Pre-Roll 10-Pack (5g) fell -13.4% to rank 9, indicating pressure on larger pack formats even as Blue Dream Hash Infused Pre-Roll 10-Pack (5g) in rank 10 edged up 2.7%. Blue Dream Hash Infused Pre-Roll 2-Pack (1g) held rank 1 with a 2.5% gain and Trainwreck Hash Infused Pre-Roll 2-Pack (1g) at rank 2 rose 7.5%, while Super Lemon Haze Hash Infused Pre-Roll 2-Pack (1g) climbed 24.8% at rank 3; eight of the top ten SKUs are Pre-Roll 2-Packs, concentrating demand in smaller, trial-friendly sizes. Despite a $29,958 sales lead for Blue Dream Hash Infused Pre-Roll 10-Pack (5g), the mix shift toward 2-Packs alongside double-digit declines in two 10-Packs implies Seattle Bubble Works is leaning into velocity over bulk, favoring breadth of strain rotation and basket penetration rather than larger pack inventory turns.
Top Selling Cannabis Brands






Data for this report comes from real-time sales reporting by participating cannabis retailers via their point-of-sale systems, which are linked up with Headset’s business intelligence software. Headset’s data is very reliable, as it comes digitally direct from our partner retailers. However, the potential does exist for misreporting in the instance of duplicates, incorrectly classified products, inaccurate entry of products into point-of-sale systems, or even simple human error at the point of purchase. Thus, there is a slight margin of error to consider. Brands listed on this page are ranked in the top twenty within the market and product category by total retail sales volume.

