Jun-2026
Sales
Trend
6-Month
Product Count
SKUs
Avg Price
YoY Sales Change
YoY Price Change
Market Insights Snapshot
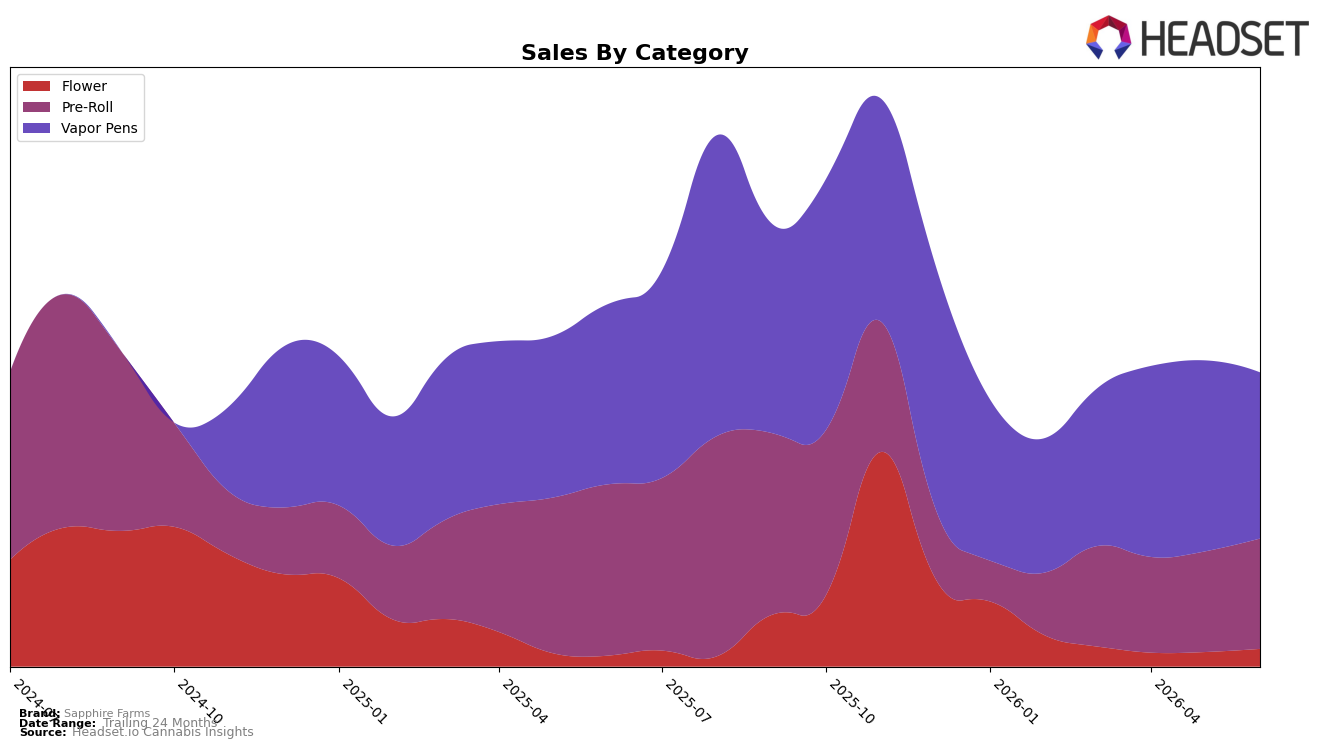
Sapphire Farms concentrated 56.54% of June 2026 sales in Vapor Pens with year-over-year decline of 7.84% and month-over-month decline of 13.05%, while Pre-Roll held 37.50% share with a 35.65% year-over-year drop but a 9.73% month-over-month lift; Flower, at 5.97% share, rose 62.28% year-over-year and 22.11% month-over-month. Despite an average price up 16.82% year-over-year and brand-level sales down 18.90% year-over-year, the category mix is tilting away from Vapor Pens into Pre-Roll and Flower on a monthly basis, implying a pivot toward formats with short-term velocity even as the largest category posts contraction.
With Vapor Pens anchored at rank 23 in New York and carrying over half of the mix at 56.54%, the 13.05% month-over-month decline suggests share risk unless the 9.73% Pre-Roll and 22.11% Flower month-over-month gains convert into repeat demand at current price architecture. The divergence between a 35.65% Pre-Roll year-over-year decline and a 62.28% Flower year-over-year increase indicates the brand’s positioning is shifting from an inhalable-heavy profile to a two-pillar approach where Flower absorbs trading-down or trial while Pre-Roll functions as a promotional or seasonal spike, implying near-term stability will depend on sustaining Flower’s growth while containing Vapor Pens’ rank-23 exposure.
Competitive Landscape
Sapphire Farms sits at rank #23 in NY Vapor Pens in June 2026, down 5 spots year over year from #18 and up 2 positions from March 2026’s #25, while its category peak was #10 in August 2025; in the same period, Jaunty held #1 but contracted with a -18.1% sales change year over year and Jetty Extracts surged from #23 to #5 alongside a 238.2% YoY sales gain, indicating that Sapphire Farms’ mid-pack slide amid both top-tier contraction and fast-riser displacement points to share being pressured by velocity concentrators and ladder-climbers rather than broad market decline.

Notable Products
Cookies N Kush Pre-Roll (1g) delivered the standout move in June 2026 with a +60.1% month-over-month surge to rank 2, while Cron Perignon Pre-Roll (1g) slipped -9.1% to rank 8. Honey Badger Pre-Roll (1g) rose +43.0% to rank 1, creating a top-two stack of fast risers that contrasts with Early Frost Pre-Roll (1g) at a modest +8.1% in rank 7. Eight of the top ten are Pre-Roll SKUs, and the upper tier is increasingly concentrated in high-velocity flavors, implying Sapphire Farms is consolidating share around a few breakout Pre-Roll formats rather than breadth across categories.
Top Selling Cannabis Brands
Data for this report comes from real-time sales reporting by participating cannabis retailers via their point-of-sale systems, which are linked up with Headset’s business intelligence software. Headset’s data is very reliable, as it comes digitally direct from our partner retailers. However, the potential does exist for misreporting in the instance of duplicates, incorrectly classified products, inaccurate entry of products into point-of-sale systems, or even simple human error at the point of purchase. Thus, there is a slight margin of error to consider. Brands listed on this page are ranked in the top twenty within the market and product category by total retail sales volume.

