.svg)

Sep-2026
Sales
Trend
6-Month
Product Count
SKUs
Avg Price
YoY Sales Change
YoY Price Change


Market Insights Snapshot
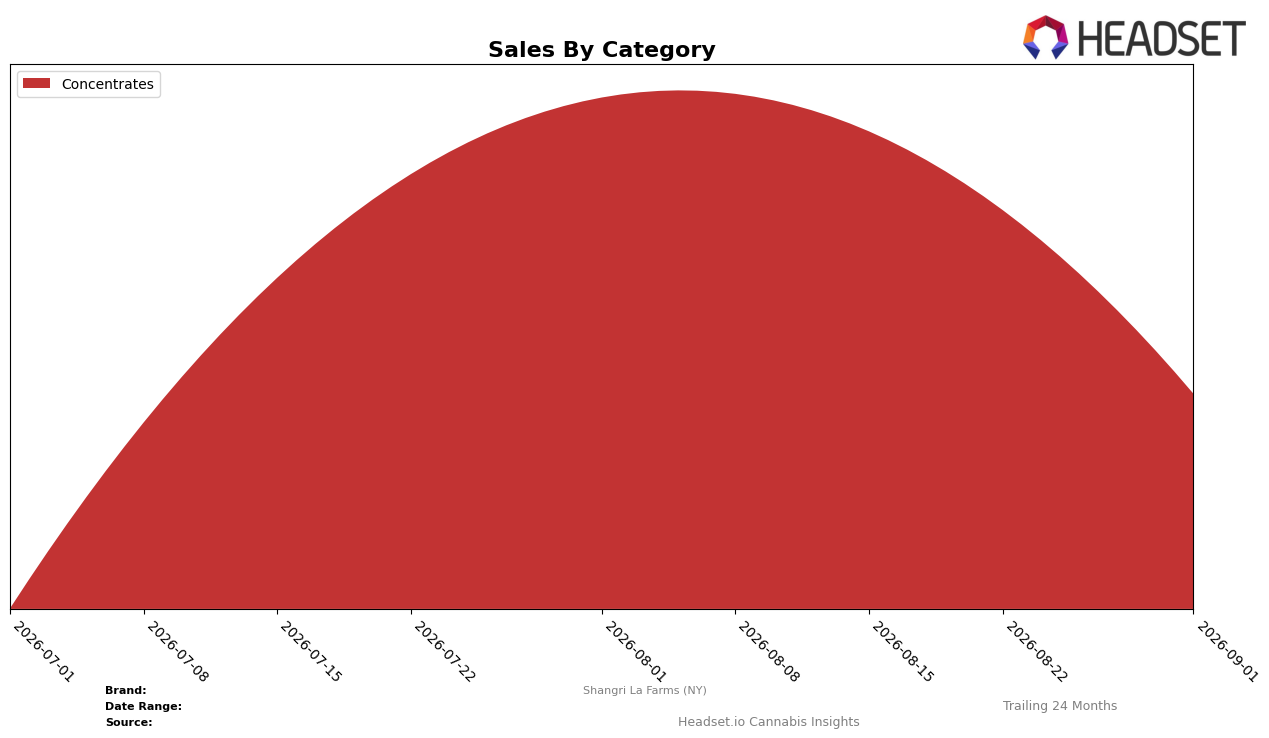
In September 2026, Shangri La Farms (NY) concentrated entirely in Concentrates with a 100.0% mix share, while month-over-month sales in that category fell 42.4% and the category rank in New York stood at 29. The average price sat at $122.91, and with no year-over-year figure reported for Concentrates and a single-category footprint, the pattern implies a narrow exposure that amplifies volatility when a 40%+ monthly swing hits the only revenue stream.
Position-wise, a 100.0% dependency on Concentrates combined with a rank of 29 in New York suggests limited shelf breadth and bargaining power, especially when a 42.4% MoM decline can compress both velocity and visibility at retail. Without diversification to buffer the single-category downdraft and absent a year-over-year growth signal, the brand’s current setup implies sensitivity to pricing and assortment moves within Concentrates, where maintaining or improving a sub-top-25 rank will likely hinge more on mix depth within subtypes than on across-category crossover.
Competitive Landscape
Shangri La Farms (NY) sits at rank #29 in NY Concentrates, with no year-over-year rank available, after peaking at #16 in August 2026 and sliding 13 positions by September 2026; that drop contrasts with Mfny (Marijuana Farms New York) holding #1 with a 43.7% YoY sales gain and UMAMII climbing to #4 from #21 alongside a 680.1% YoY sales surge. Against this, Jetpacks sits at #3 despite a -8.0% YoY sales change while RYTHM advanced from #4 to #2 with a 43.7% YoY increase, indicating that Shangri La Farms (NY)’s rank descent from #16 to #29 during August 2026–September 2026 reflects share being absorbed by faster-advancing rivals and implies a need to reposition within segments where upward mobility is still evident.

Notable Products
The steepest decline came from Sour Diesel Live Hash Rosin (2g), down 57.1% month over month and sitting at rank 4, while Canal Street Runtz Live Hash Rosin (2g) held rank 1 despite a 14.8% drop. ZkittleZ Live Hash Rosin (2g) fell 26.0% at rank 3, and Sour Papaya Live Hash Rosin (1g) collapsed 83.1% even as its 2g counterpart at rank 2 slid 41.2%. Eight of the top ten are Concentrates SKUs, and the 1g formats plunged faster than the 2g formats, with ZkittleZ Live Hash Rosin (1g) down 87.1% versus its 2g at -26.0%, implying a trade-up or supply-driven shift away from smaller packs. Taken together, concentrated rank stability at the top alongside double-digit contractions across sizes signals a portfolio leaning into higher-gram rosin while overall demand or availability tightens.
Top Selling Cannabis Brands






Data for this report comes from real-time sales reporting by participating cannabis retailers via their point-of-sale systems, which are linked up with Headset’s business intelligence software. Headset’s data is very reliable, as it comes digitally direct from our partner retailers. However, the potential does exist for misreporting in the instance of duplicates, incorrectly classified products, inaccurate entry of products into point-of-sale systems, or even simple human error at the point of purchase. Thus, there is a slight margin of error to consider. Brands listed on this page are ranked in the top twenty within the market and product category by total retail sales volume.

