.svg)


Market Insights Snapshot
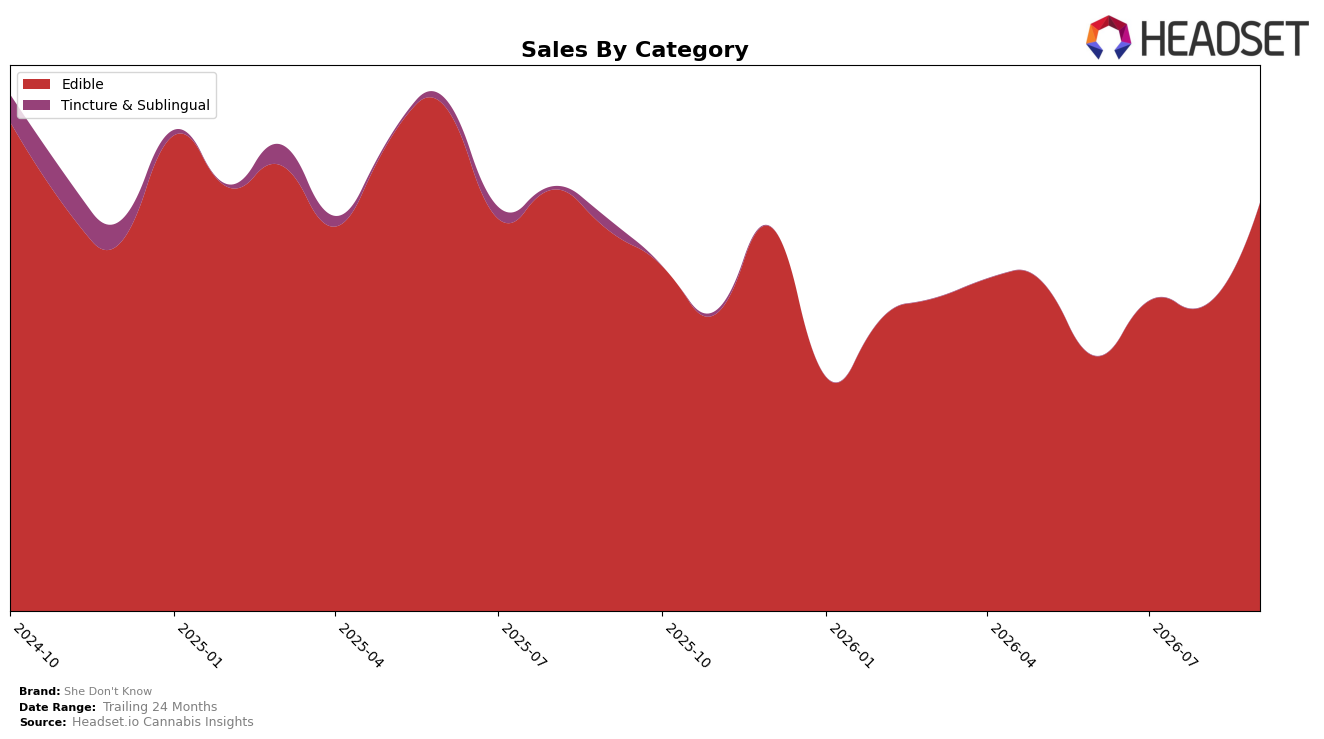
In September 2026, She Don't Know operated as a single-category brand with Edible at 100.0% of mix, posting 7.14% year-over-year growth and a 33.75% month-over-month lift, while overall brand sales were up 4.18% year-over-year and down 16.39% versus 24 months. The average price rose 27.01% year-over-year to $8.30, alongside a category-specific month-over-month upswing of 33.75%, which together indicate that September volume likely expanded even as pricing moved higher; the thesis is that the Edible-only concentration created a short-term momentum spike that outpaced the broader brand trend but leaves exposure concentrated in one product format.
Within Oregon Edibles, She Don't Know ranked 24, with Edible holding 100.0% of brand sales and posting 7.14% year-over-year and 33.75% month-over-month growth, while the broader brand 24-month trajectory sits at -16.39%. The 27.01% year-over-year price increase alongside a 33.75% month-over-month sales jump implies current demand elasticity is favorable at the prevailing price point, but the 100.0% category reliance and rank 24 position suggest the path to durable share gain will depend on either deepening Edible differentiation or reintroducing mix diversity to buffer against category-specific volatility.
Competitive Landscape
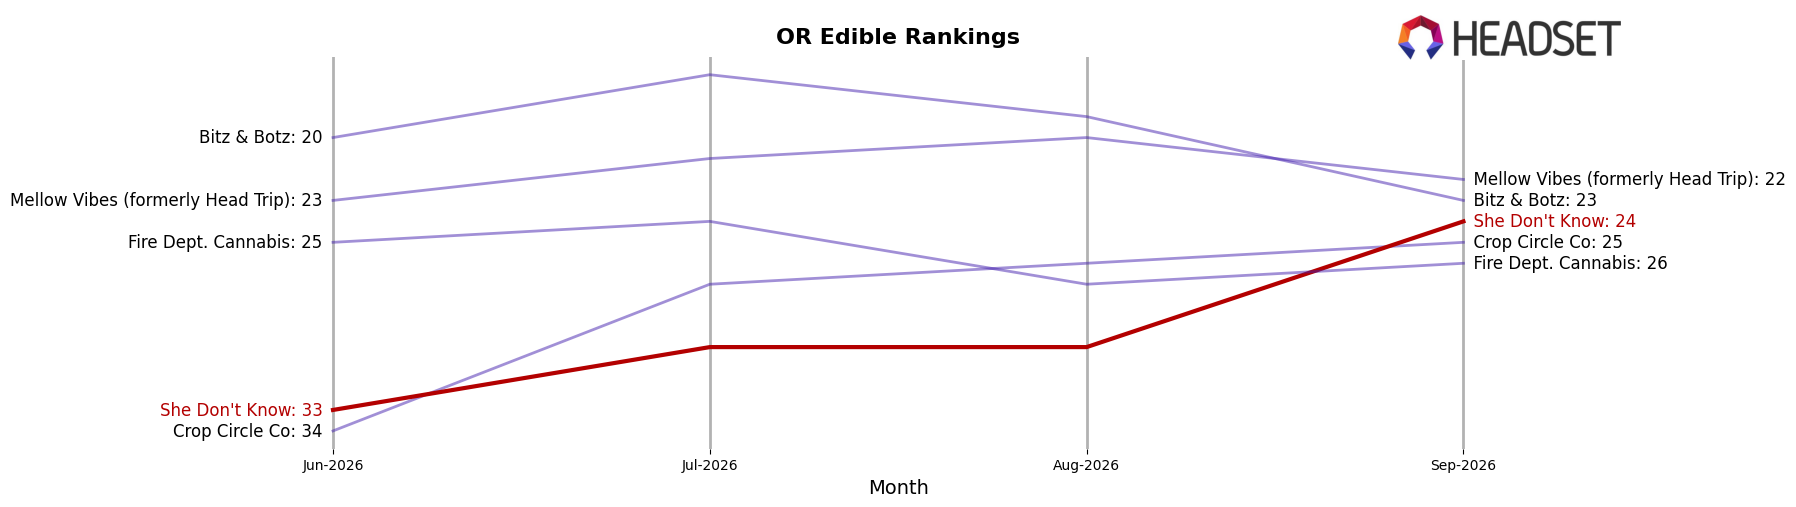
She Don't Know ranks #24 in OR Edible in September 2026, improving 3 positions year over year from #27 and jumping 9 spots since June 2026 from #33 to a peak of #24 in September 2026; by contrast, Wyld held steady at #1 year over year with sales up 4.3% while Gron / Grön stayed at #2 despite a 5.0% sales decline, and Mule Extracts maintained #5 with a 5.9% sales gain. This mix of upward rank mobility for She Don't Know alongside flat top-tier ranks and divergent competitor sales trends implies the brand is carving out mid-tier share by climbing when incumbents are either holding position or absorbing mild contraction.
Notable Products
Key Lime Rosin Cookie (100mg) posted the standout move in September 2026 with a 495.5% month-over-month surge to rank 5, while Red Velvet Rosin Cookie (100mg) fell 30.1% to rank 7, indicating a decisive tilt within the cookie line toward a single standout SKU. Blueberry Fruit Crunchers Gummy (100mg) jumped 112.4% to rank 1 as Cherry Fruit Crunchers Gummy (100mg) rose 58.6% to rank 3, whereas Strawberry Fruit Crunchers Gummy (100mg) declined 11.8% to rank 6, showing the gummy portfolio is skewing toward bold fruit profiles rather than legacy flavors. With eight of the top ten positioned in Edible gummies and cookies, and two separate SKUs breaking triple-digit MoM growth while two others fell more than 10%, She Don't Know is concentrating assortment and promotion behind a few velocity winners and pruning slower variants.
Top Selling Cannabis Brands






Data for this report comes from real-time sales reporting by participating cannabis retailers via their point-of-sale systems, which are linked up with Headset’s business intelligence software. Headset’s data is very reliable, as it comes digitally direct from our partner retailers. However, the potential does exist for misreporting in the instance of duplicates, incorrectly classified products, inaccurate entry of products into point-of-sale systems, or even simple human error at the point of purchase. Thus, there is a slight margin of error to consider. Brands listed on this page are ranked in the top twenty within the market and product category by total retail sales volume.

