Jun-2026
Sales
Trend
6-Month
Product Count
SKUs
Avg Price
YoY Sales Change
YoY Price Change
Market Insights Snapshot
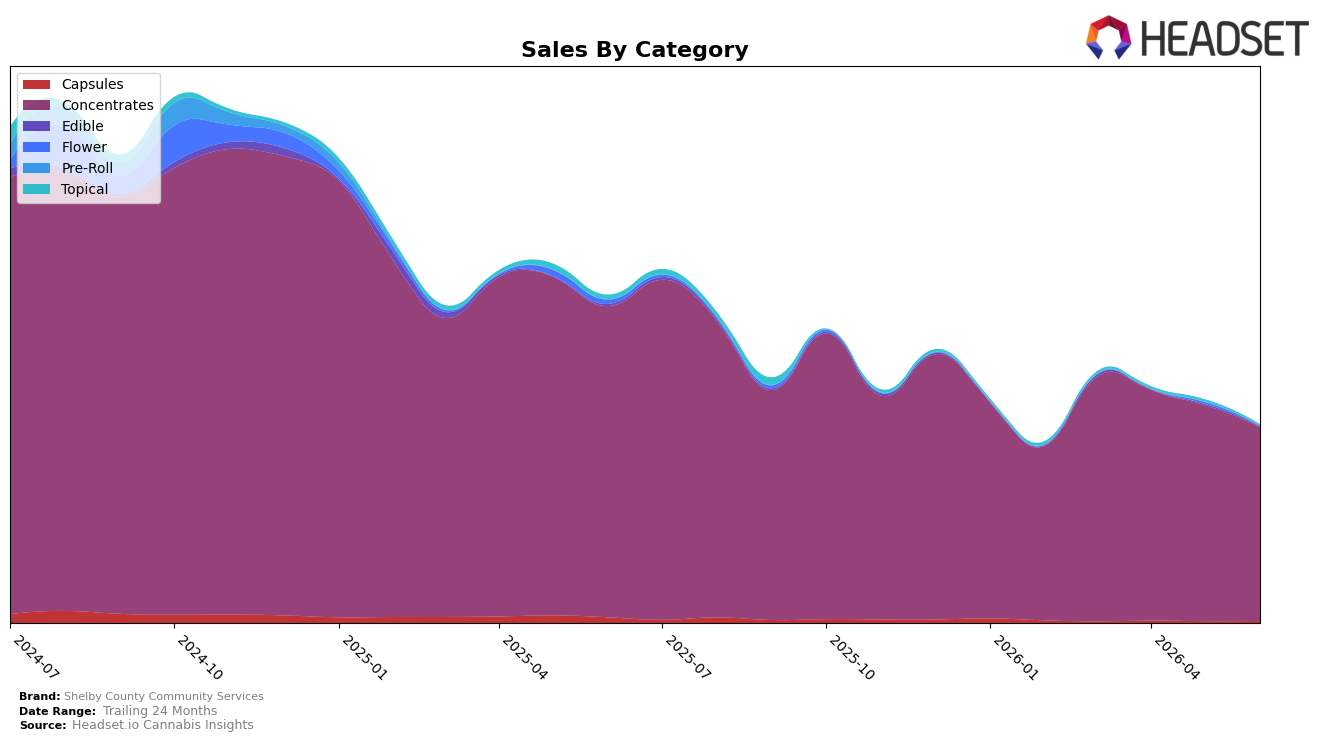
In June 2026, Shelby County Community Services remained highly concentrated in Concentrates at 98.41% share, with that category down 37.79% year over year and 10.28% month over month, while Capsules held 0.99% share with a 64.86% year-over-year decline but a 14.59% month-over-month uptick. Topical and Edible were marginal at 0.40% and 0.20% share, with steep year-over-year drops of 80.63% and 77.49% and sharper month-over-month declines of 59.04% and 61.73%. With the brand ranked 19 in Concentrates in Illinois and average price up 0.86% year over year to $45.33, the mix indicates dependence on a shrinking core where price stability has not offset volume contraction, implying continued share and rank risk if category breadth does not expand.
The concentrated mix paired with a 39.73% brand-level year-over-year sales decline and a 71.31% drop versus 24 months, alongside a 10.28% month-over-month slide in the core category, suggests that incremental gains in Capsules at 14.59% month over month are too small at 0.99% share to change trajectory. With Concentrates at 98.41% share and the brand positioned 19 in Illinois, the pattern implies the brand’s positioning is anchored to a narrowing segment where small line extensions in Capsules and diminished presence in Topical and Edible (down 59.04% and 61.73% month over month) are insufficient, signaling the need to rebalance toward categories with less acute declines to stabilize rank and mitigate further concentration risk.
Competitive Landscape
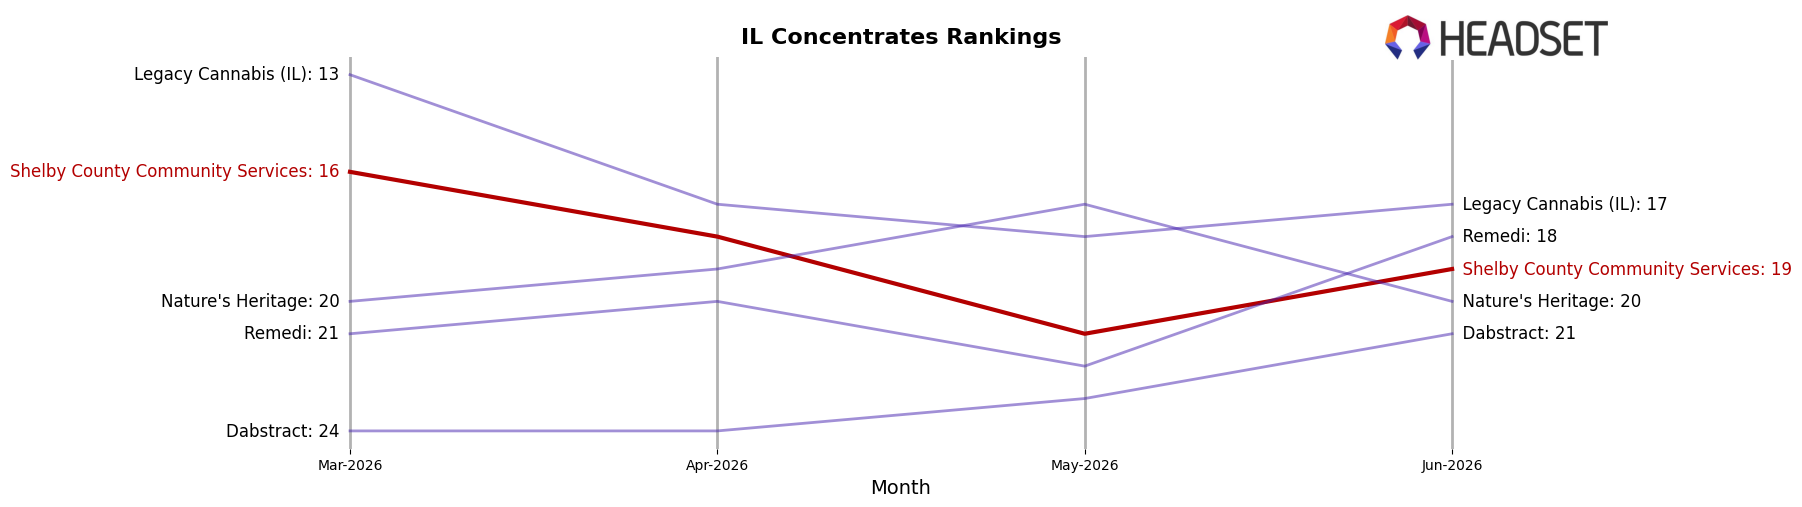
Shelby County Community Services sits at rank #19 in IL Concentrates in June 2026, falling 5 positions year over year from #14 and down 3 spots from March 2026’s #16, while still trailing its peak rank of #11 from July 2025 by 8 places; in contrast, Aeriz held #1 with a 3.2% year-over-year sales increase and IC Collective advanced from #7 to #3 alongside 37.7% year-over-year sales growth, and Cresco Labs moved from #9 to #5 with 43.4% year-over-year sales growth, indicating that competitors are converting category momentum into rank gains while Shelby County Community Services is ceding relative position; the pattern implies share is concentrating at the top and that stabilizing rank will require reversing multi-quarter slippage rather than relying on overall category expansion.
Notable Products
Purple Sunset RSO (1g) delivered the standout move in June 2026 with a 102.97% month-over-month surge that vaulted it into a shared rank of 3, while CBD/THC 10:1 Sweet Pea High CBD CO2 RSO Oil Syringe (1g) fell 17.28% to rank 3 as well. The top two positions were held by 9lb Hammer CO2 Oil RSO Syringe (1g) at rank 1 with +9.37% and Moon Gaze CBN Oil RSO Syringe (1g) at rank 2 with +24.53%, signaling demand consolidation at the top despite Berry Payton CO2 Syringe (1g) sliding 33.08% to rank 6. With all top-10 placements coming from Concentrates and one SKU at $23,854, the concentration in RSO/CO2 formats implies Shelby County Community Services is tilting its product mix toward higher-velocity syringe-based concentrates while trimming underperforming flavors.
Top Selling Cannabis Brands
Data for this report comes from real-time sales reporting by participating cannabis retailers via their point-of-sale systems, which are linked up with Headset’s business intelligence software. Headset’s data is very reliable, as it comes digitally direct from our partner retailers. However, the potential does exist for misreporting in the instance of duplicates, incorrectly classified products, inaccurate entry of products into point-of-sale systems, or even simple human error at the point of purchase. Thus, there is a slight margin of error to consider. Brands listed on this page are ranked in the top twenty within the market and product category by total retail sales volume.

