May-2026
Sales
Trend
6-Month
Product Count
SKUs
Avg Price
YoY Sales Change
YoY Price Change
Market Insights Snapshot
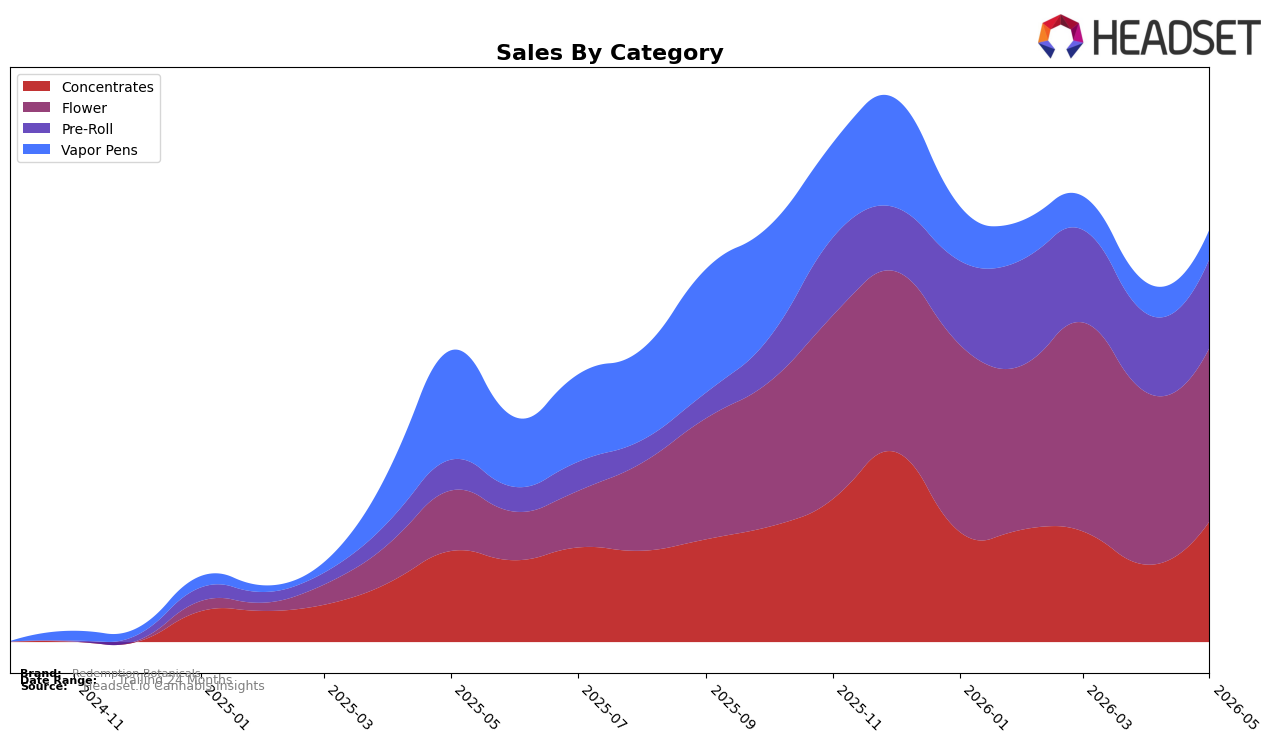
In May 2026, Redemption Botanicals’ mix tilted toward Flower at 42.09% share with 187.51% YoY growth and a 0.94% MoM lift, while Concentrates held 29.25% share with 32.55% YoY and a 55.96% MoM surge; Pre-Roll captured 21.57% share on 189.85% YoY and 12.91% MoM growth, and Vapor Pens dropped to 7.09% share with -73.25% YoY and -5.18% MoM declines. The brand’s average price rose 9.71% YoY to $37.24, alongside Flower’s higher ticket at $62.81 and Pre-Roll’s lower ticket at $21.68, implying mix-driven revenue uplift even as Vapor Pens contracted. The pattern indicates a pivot toward combustion formats where rapid YoY gains in Flower and Pre-Roll outweigh the shrinking Vapor Pens base, positioning May 2026 as a volume-and-mix expansion month rather than price-only growth.
The mix shift toward Flower and Pre-Roll, coupled with a 55.96% MoM spike in Concentrates, implies the brand is concentrating on inhalable value tiers that can scale quickly while maintaining a premium anchor in Flower’s $62.81 average price; this aligns with a rank of 57 in Flower in Illinois, suggesting headroom if share gains in combustion can translate to distribution. With Pre-Roll up 189.85% YoY but averaging $21.68 and Vapor Pens down -73.25% YoY, the trade-off favors accessible entry points and basket fillers over higher-margin cartridges, which likely lifted overall sales by 41.54% YoY through unit velocity and cross-category pull rather than reliance on pens. The implication is a defensible positioning in Flower-led baskets where incremental gains in rank can be earned by reinforcing the fastest-growing combustion subsegments while containing further erosion in Vapor Pens.
Competitive Landscape
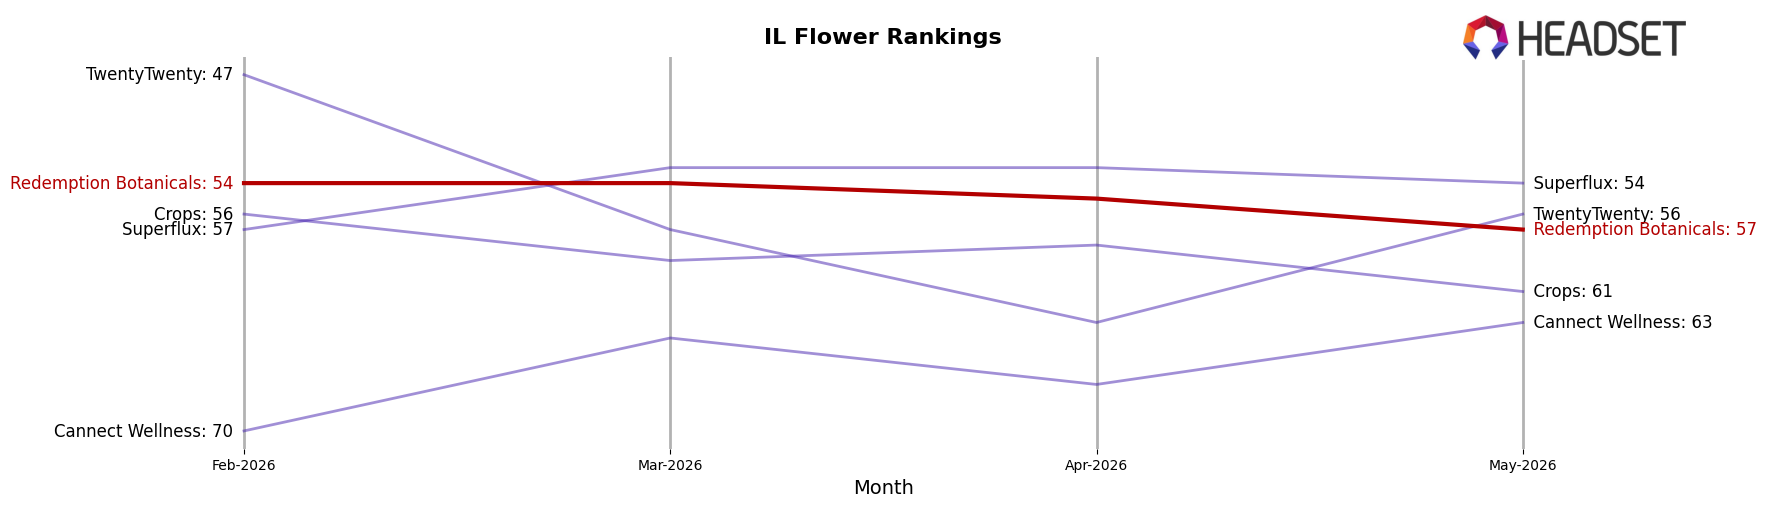
Redemption Botanicals sits at rank #57 in IL Flower in May 2026, improving 9 positions from #66 year over year, while slipping 3 spots from #54 over the last three months; the brand also remains 6 places off its peak at #51 from December 2025. Competitive pressure is clear at the top: High Supply / Supply held #1 with 29.8% year-over-year sales growth as RYTHM stayed at #2 despite a -12.2% decline, indicating that upward mobility is available but uneven; meanwhile, Good Green advanced from #6 to #3 alongside 17.0% growth, while Simply Herb slid from #4 to #5 with -33.0%, suggesting rank changes are driven by divergent momentum rather than uniform market tides. The pattern implies Redemption Botanicals’ year-over-year climb and recent three-month softness create a mid-pack trajectory where incremental share gains are attainable if volatility at the top continues to redistribute rank positions.
Notable Products
Rare Extracts RSO (1g) posted the standout move in May 2026 with a 122.8% month-over-month gain and the number 1 rank, indicating a sharp pull toward Concentrates even as Permanent Marker (3.5g) slipped 4.4% and sat at rank 9. Three of the top ten are Concentrates, and four of the top ten are Pre-Rolls, but only the RSO shows a triple-digit MoM acceleration while the lone negative mover in the top ten remains under a 10% decline; this mix implies a pivot toward high-potency extract-led velocity rather than broad Pre-Roll expansion.
Top Selling Cannabis Brands
Data for this report comes from real-time sales reporting by participating cannabis retailers via their point-of-sale systems, which are linked up with Headset’s business intelligence software. Headset’s data is very reliable, as it comes digitally direct from our partner retailers. However, the potential does exist for misreporting in the instance of duplicates, incorrectly classified products, inaccurate entry of products into point-of-sale systems, or even simple human error at the point of purchase. Thus, there is a slight margin of error to consider. Brands listed on this page are ranked in the top twenty within the market and product category by total retail sales volume.

