.svg)

Sep-2026
Sales
Trend
6-Month
Product Count
SKUs
Avg Price
YoY Sales Change
YoY Price Change


Market Insights Snapshot
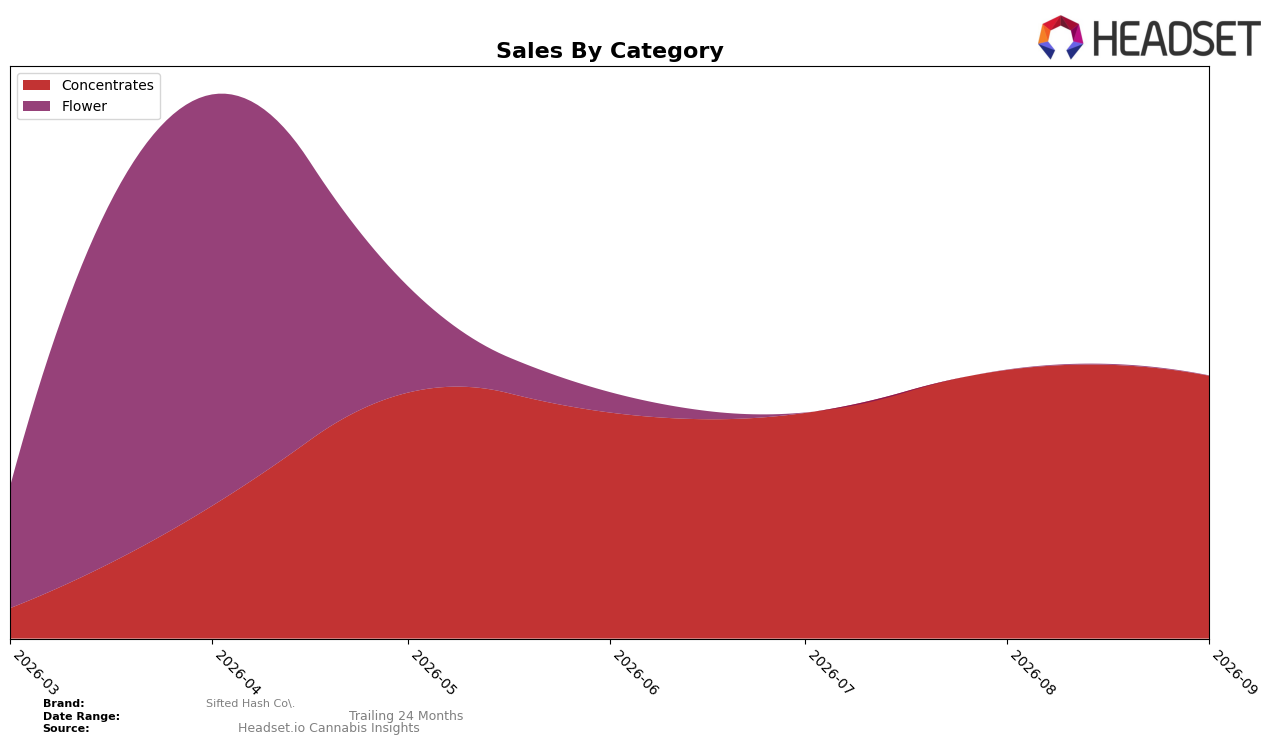
In September 2026, Sifted Hash Co. operated as a single-category brand with Concentrates at 100.0% of mix, while month-over-month volume signals tightened with a -2.20% change and a category rank position of 46 in Concentrates across New Jersey. With no year-over-year rate reported and average price at $34.80, the lack of mix diversification paired with a sub-top-40 rank suggests concentration risk: a fully concentrated 100.0% mix amplifies the impact of a -2.20% monthly dip on visibility and retail pull within rank 46.
The combination of a 100.0% Concentrates reliance and rank 46 in New Jersey implies limited insulation against category-specific volatility and fewer cross-category discovery paths, which can cap velocity when MoM turns negative by -2.20%. To improve positioning, the data pattern points to either deeper penetration within Concentrates to move the rank closer to the top 30 or selective category adjacency testing to reduce the sensitivity that a 100.0% mix imposes on performance when monthly fluctuations recur.
Competitive Landscape
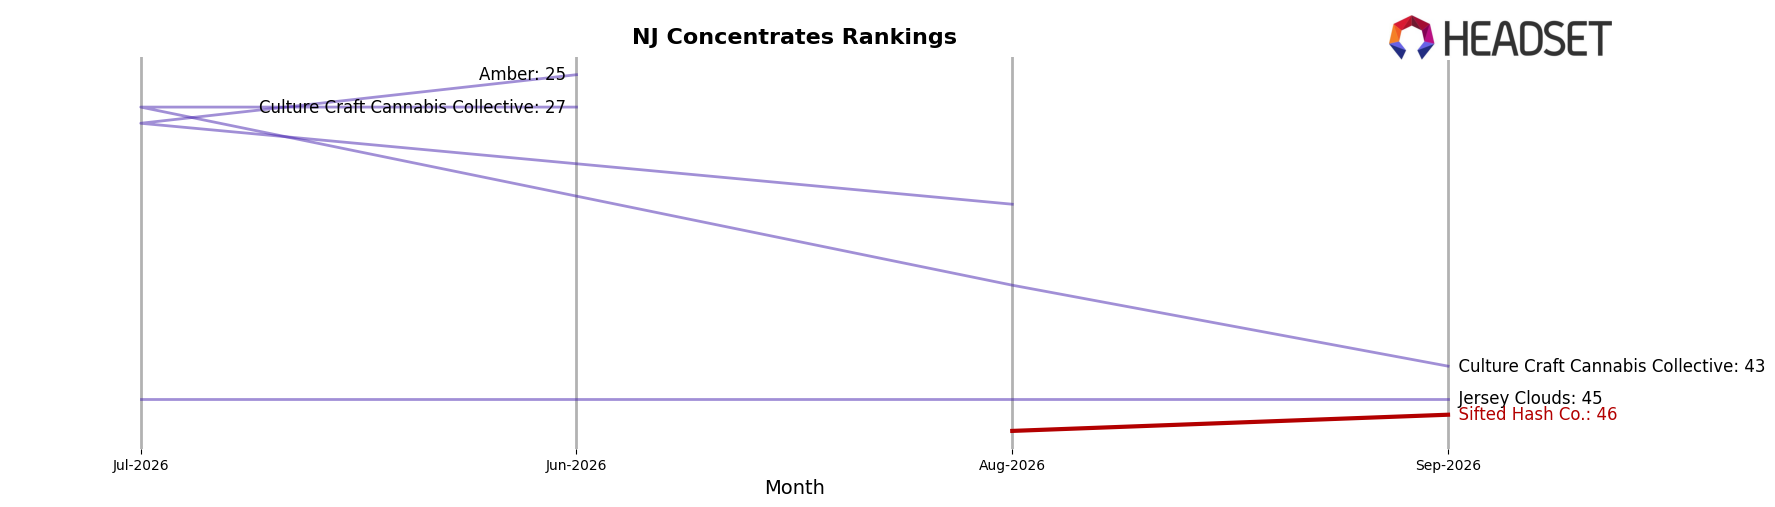
Sifted Hash Co. sits at rank #46 in New Jersey Concentrates in September 2026, down 3 spots from #43 in June 2026, while year-over-year rank is unavailable; in contrast, Grassroots holds #1 after a +1 YoY climb from #2 with +21.7% YoY sales, and RYTHM is #2 after a -1 YoY slip from #1 with -33.2% YoY sales, indicating Sifted Hash Co.’s recent 3-position slide coincides with a top-tier reshuffle. With Black Label Brand steady at #3 (0 rank change YoY with -5.1% YoY sales) and Pyramid Pens advancing to #5 from #10 (+5 ranks with +46.7% YoY sales), Sifted Hash Co.’s deterioration from its peak #43 in June 2026 to #46 in September 2026 suggests that share is being redistributed toward faster-rising mid-pack players and that without a counter-move its trajectory implies further crowd-out below the top 40.
Notable Products
Banana OG Water Hashish (2g) posted the steepest decline at -76.5% MoM, dropping to rank 4 from a prior top-three trajectory, while Blackberry Water Hashish (2g) fell -78.1% MoM to rank 5; together these contractions offset Super Silver Haze Cold Pressed Hashish (2g), which jumped +64.3% MoM into rank 2. Chem Dawg Cold Pressed Hashish (2g) rose +27.9% MoM to hold rank 1, and three of the top five SKUs are Cold Pressed Hashish, indicating demand consolidation in that sub-format over Water Hash; the dollar gap to number two sits at $3,288 despite the latter’s faster growth. This pattern implies Sifted Hash Co. is being pulled toward Cold Pressed Hashish-led volume where growth rates and rank stability can compound even as Water Hash volatility introduces downside risk.
Top Selling Cannabis Brands






Data for this report comes from real-time sales reporting by participating cannabis retailers via their point-of-sale systems, which are linked up with Headset’s business intelligence software. Headset’s data is very reliable, as it comes digitally direct from our partner retailers. However, the potential does exist for misreporting in the instance of duplicates, incorrectly classified products, inaccurate entry of products into point-of-sale systems, or even simple human error at the point of purchase. Thus, there is a slight margin of error to consider. Brands listed on this page are ranked in the top twenty within the market and product category by total retail sales volume.

