Jun-2026
Sales
Trend
6-Month
Product Count
SKUs
Avg Price
YoY Sales Change
YoY Price Change
Market Insights Snapshot
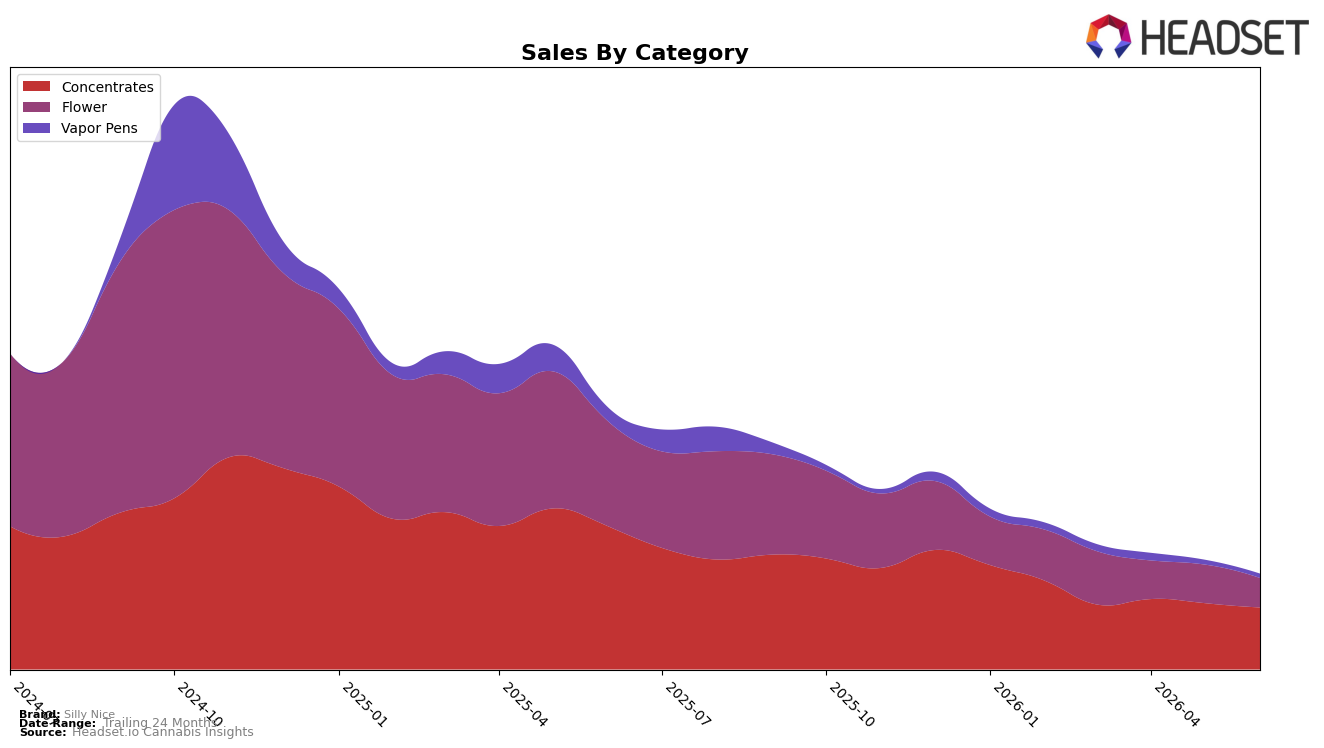
Silly Nice’s mix in June 2026 concentrated further into Concentrates at 64.95% share (ranked 27th in New York), while Flower contracted to 30.67% share; the remaining 4.38% sat in Vapor Pens. Year over year, Concentrates sales fell 56.76% and Flower declined 72.11%, and month over month, Concentrates slipped 6.57% while Flower dropped 23.79%. With Vapor Pens down 69.46% YoY and 9.55% MoM, the portfolio skews toward a category that is shrinking less quickly than others, implying a defensive tilt around Concentrates that trades lower breadth for relatively slower erosion.
Average price for the brand eased 2.84% YoY to $47.06, alongside a Concentrates price point of $44.74 and a Flower price at $56.57, while the brand’s 24‑month sales decline of 67.48% outpaced the current 63.57% YoY slide. The 27th rank in New York Concentrates combined with a 6.57% MoM contraction in that category versus a 23.79% MoM drop in Flower indicates the brand is staking relative position where it bleeds slower, suggesting near-term positioning as a Concentrates-led specialist rather than a balanced multi-category player.
Competitive Landscape
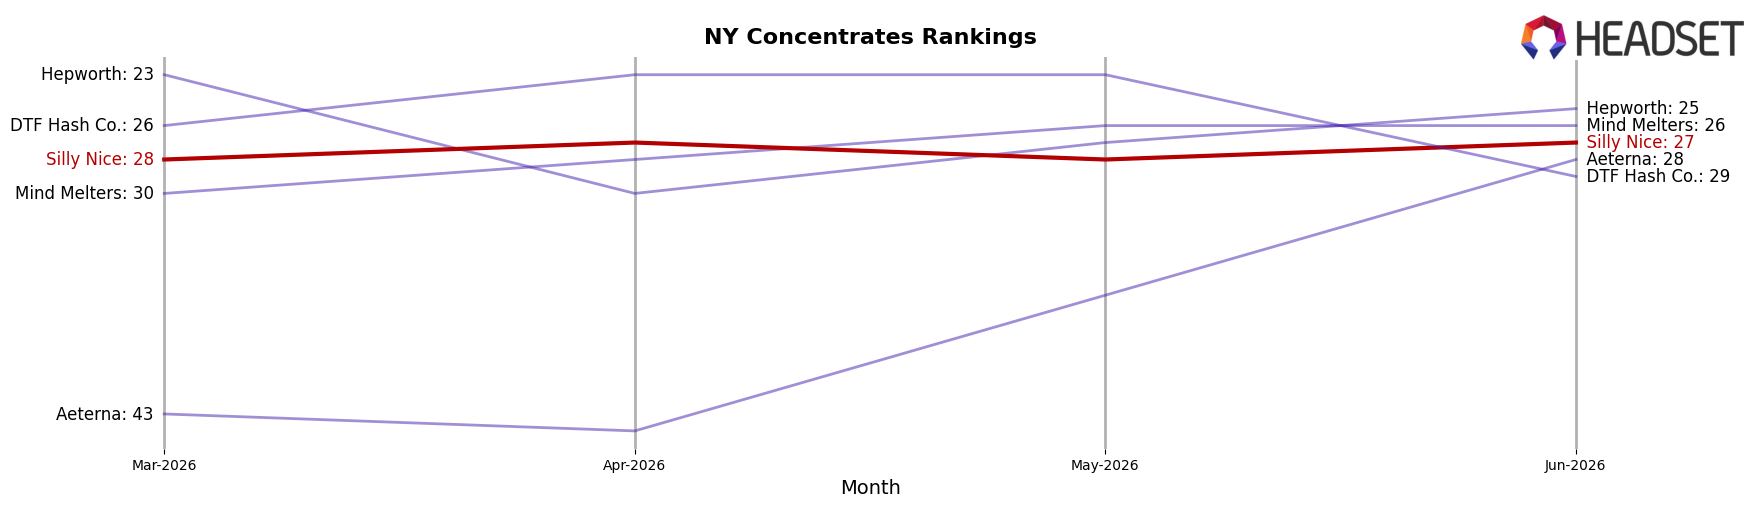
Silly Nice sits at rank #27 in NY Concentrates in June 2026, falling 11 places from rank #16 year over year, while improving 1 position versus March 2026 from #28 to #27; against that backdrop, category leaders shifted with Mfny (Marijuana Farms New York) holding #1 from last year’s #1 and UMAMII jumping from #26 to #3, indicating that gains are concentrating among a few movers as mid-tier brands cede ground. Despite a historical peak at #9 in July 2024, the brand’s June 2026 position of #27 and a 24-rank gap to today’s #3 underline a widened competitive distance as Jetpacks climbed from #4 to #2 and RYTHM advanced from #7 to #4; the implied pattern is that Silly Nice’s rank trajectory signals erosion from prior highs as the category’s top tier consolidates share upward.
Notable Products
Silly Nice Infused Frosted Flower (3.5g) posted the steepest movement in June 2026 with a -57.6% MoM drop at rank 7, while Pink Stardust Distillate Cartridge (1g) fell -14.7% to rank 6; in contrast, Kombucha Infused Flower (3.5g) climbed +30.9% at rank 8. Silly Nice THCA Diamond Powder (1g) held rank 1 with a -7.8% MoM dip and Silly Nice THCA Diamond Powder (0.5g) slid -13.9% at rank 3, placing two Diamond Powder SKUs in the top three even as the 0.5g format weakened. Four of the top ten are Flower SKUs, but two of those—Silly Nice Infused Frosted Flower (3.5g) at -57.6% and Papaya Wine Infused Frosted Flower (3.5g) at -48.7%—contracted sharply, concentrating mix risk despite Kombucha Infused Flower (3.5g)’s +30.9% gain. The pattern implies near-term reliance on Concentrates leadership for volume stability while infused Flower requires SKU pruning or reformulation to prevent margin drag.
Top Selling Cannabis Brands
Data for this report comes from real-time sales reporting by participating cannabis retailers via their point-of-sale systems, which are linked up with Headset’s business intelligence software. Headset’s data is very reliable, as it comes digitally direct from our partner retailers. However, the potential does exist for misreporting in the instance of duplicates, incorrectly classified products, inaccurate entry of products into point-of-sale systems, or even simple human error at the point of purchase. Thus, there is a slight margin of error to consider. Brands listed on this page are ranked in the top twenty within the market and product category by total retail sales volume.

