May-2026
Sales
Trend
6-Month
Product Count
SKUs
Avg Price
YoY Sales Change
YoY Price Change
Market Insights Snapshot
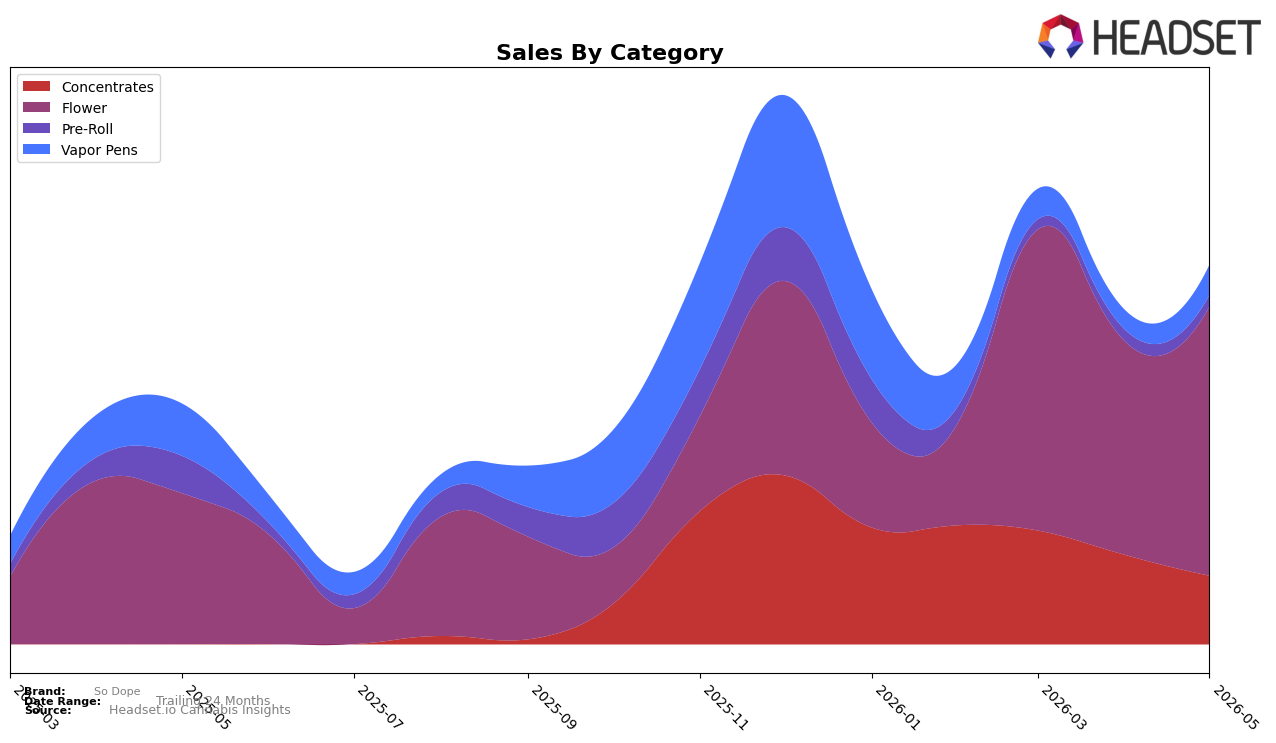
In May 2026, So Dope concentrated 71.06% of sales in Flower with 78.39% year-over-year growth and 26.17% month-over-month expansion, while Vapor Pens held 7.91% share with a 54.38% month-over-month rebound against a -42.51% year-over-year decline. Concentrates accounted for 18.08% share but contracted -23.38% month-over-month, and Pre-Roll at 2.95% share slid -2.73% month-over-month alongside a -69.88% year-over-year drop; paired with a -1.58% brand-wide average price change and a rank of 90 in Flower in New York, the mix points to reliance on one growth engine while secondary formats cycle down. The pattern implies the category stack is widening volatility: Flower is pulling overall sales up 57.73% year-over-year, but the decline in Pre-Roll and Concentrates adds exposure to category-specific swings even as Vapor Pens shows tactical month-over-month recovery.
These shifts suggest a positioning anchored in mid-to-premium Flower (average Flower price $37.18) that can absorb price softness (-1.58% YoY brand average) while leveraging seasonal or promotional lifts, whereas the -23.38% month-over-month drop in Concentrates and the -69.88% year-over-year contraction in Pre-Roll indicate weak repeatability in smaller baskets. With rank 90 in New York Flower and Vapor Pens rebounding 54.38% month-over-month despite a steep -42.51% year-over-year gap, the brand’s defensible near-term posture is to double down where share is already 71.06% and selectively test cross-over bundles to stabilize the 18.08% and 2.95% niches; the implication is a core-led strategy that treats non-Flower as volatility dampeners rather than primary growth lanes.
Competitive Landscape
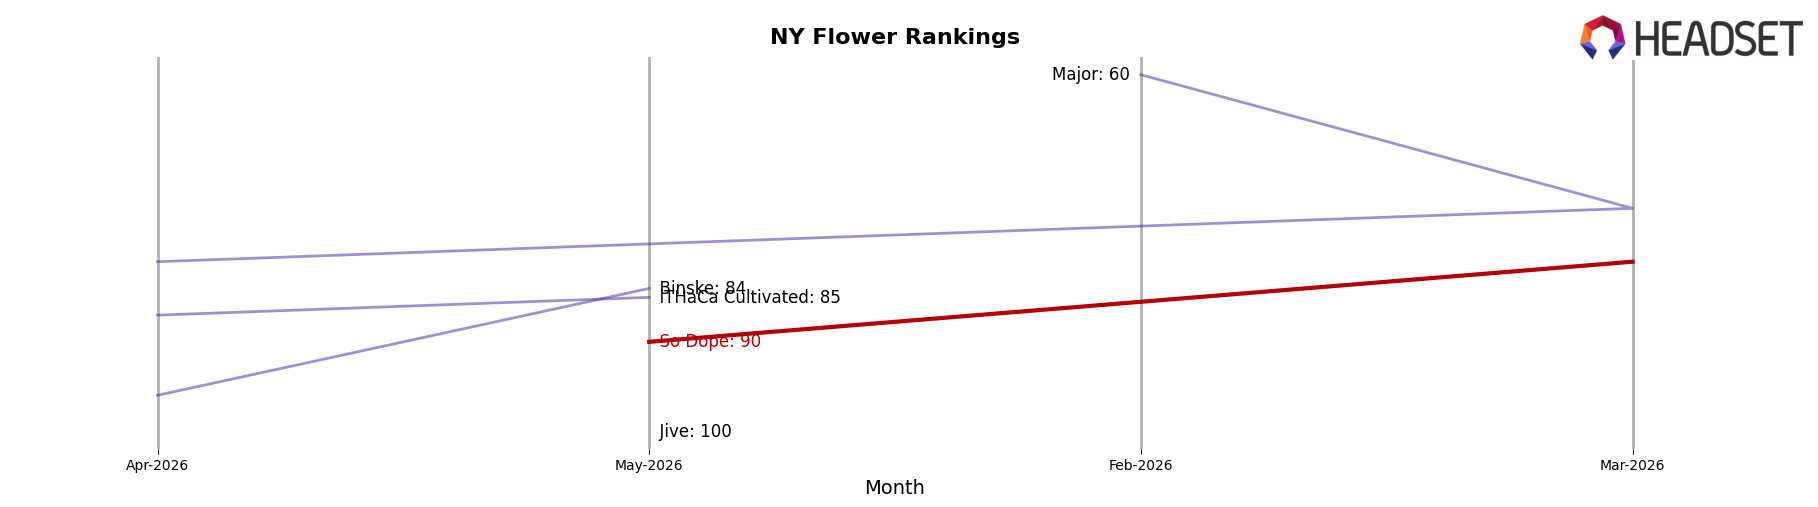
So Dope sits at rank #90 in May 2026, improving 23 positions from #113 year over year, and it is up 46 spots versus #136 in February 2026 while still trailing its March 2026 peak of #81 by 9 places; meanwhile, Leal climbed from #11 to #1 and RYTHM moved from #10 to #4 as So Dope advanced only from #113 to #90, implying that So Dope’s upward drift is modest relative to faster-moving leaders and points to a trajectory consistent with incremental share recovery rather than a rapid leap into the top tiers.
Notable Products
Silver Black Haze (3.5g) posted the steepest decline in May 2026, down 71.5% month over month and sitting at rank 7, while Citrus Guava Live Sugar (2g) also fell 37.1% to rank 8. In contrast, Mango OG Distillate Cartridge (1g) rose 19.7% to rank 9 and Venom Runtz (3.5g) gained 6.7% at rank 5, with Harlem 21 (3.5g) holding rank 1 on $24,010 in sales. With Flower occupying 6 of the top 10 ranks and the heaviest volatility concentrated in one Flower SKU and one Concentrates SKU, the mix points to a pivot toward stabilizing core Flower while testing selective recovery in Vapor Pens.
Top Selling Cannabis Brands
Data for this report comes from real-time sales reporting by participating cannabis retailers via their point-of-sale systems, which are linked up with Headset’s business intelligence software. Headset’s data is very reliable, as it comes digitally direct from our partner retailers. However, the potential does exist for misreporting in the instance of duplicates, incorrectly classified products, inaccurate entry of products into point-of-sale systems, or even simple human error at the point of purchase. Thus, there is a slight margin of error to consider. Brands listed on this page are ranked in the top twenty within the market and product category by total retail sales volume.

