.svg)


Market Insights Snapshot
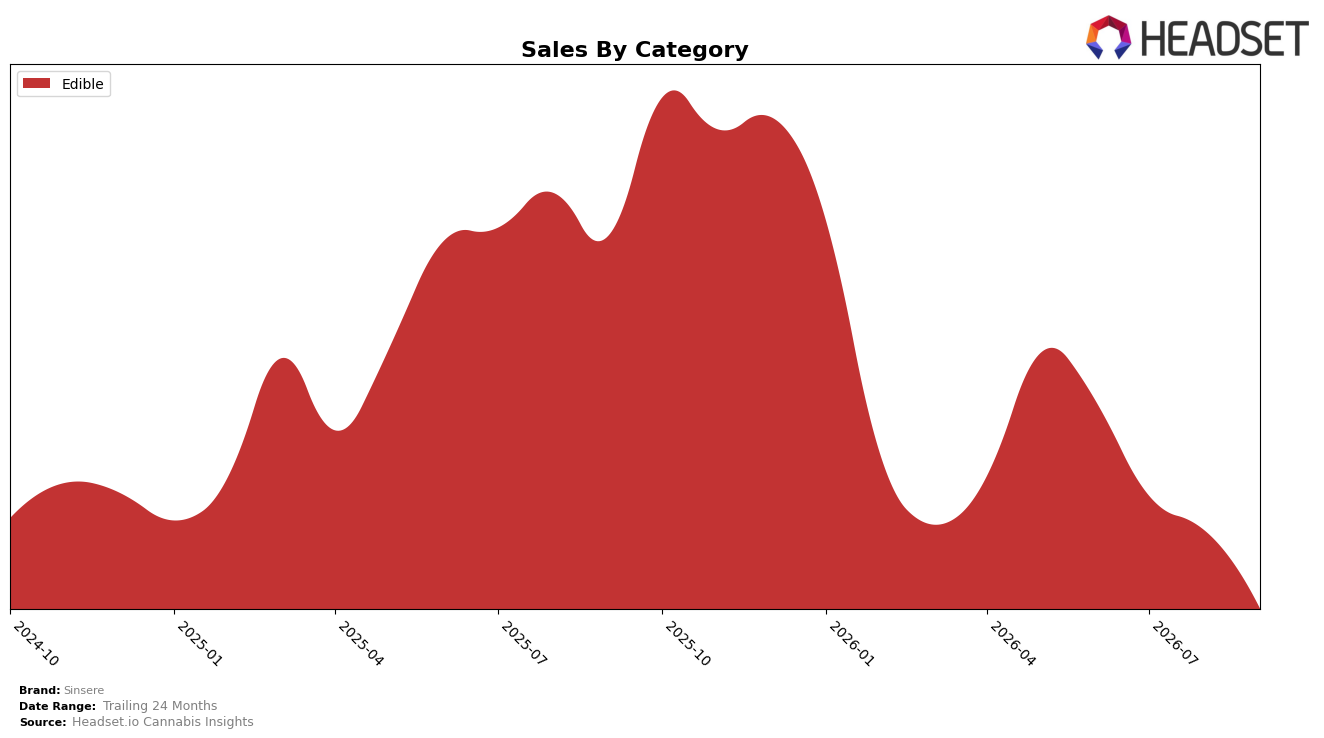
Sinsere operated as a single-category brand in September 2026, with Edible accounting for 100.0% of sales and showing a year-over-year decline of 74.18% alongside a month-over-month drop of 37.57%. The brand’s average price fell 7.25% year over year to $17.02, indicating that mix-driven unit trends diverged from pricing, while total brand sales contracted 74.18% YoY and 47.13% over 24 months. The absence of any non-Edible contribution magnifies volatility, and the combined 100.0% category concentration with a 37.57% MoM decline implies overexposure to a shrinking pocket of demand.
The consolidation into Edible with a 100.0% share, paired with a 74.18% YoY sales contraction and a 7.25% YoY price decrease, signals that volume erosion is outpacing pricing adjustments and weakening Sinsere’s shelf presence in Colorado. With rank unavailable within Edible in Colorado and a 37.57% MoM decline compressing recent momentum, the brand’s positioning skews toward a price-reactive stance rather than a demand-creating one. This pattern implies that without diversification beyond Edible or a sharper price-pack architecture, Sinsere’s visibility and buyer retention trajectory will continue to be dictated by a single category’s downturn.
Competitive Landscape
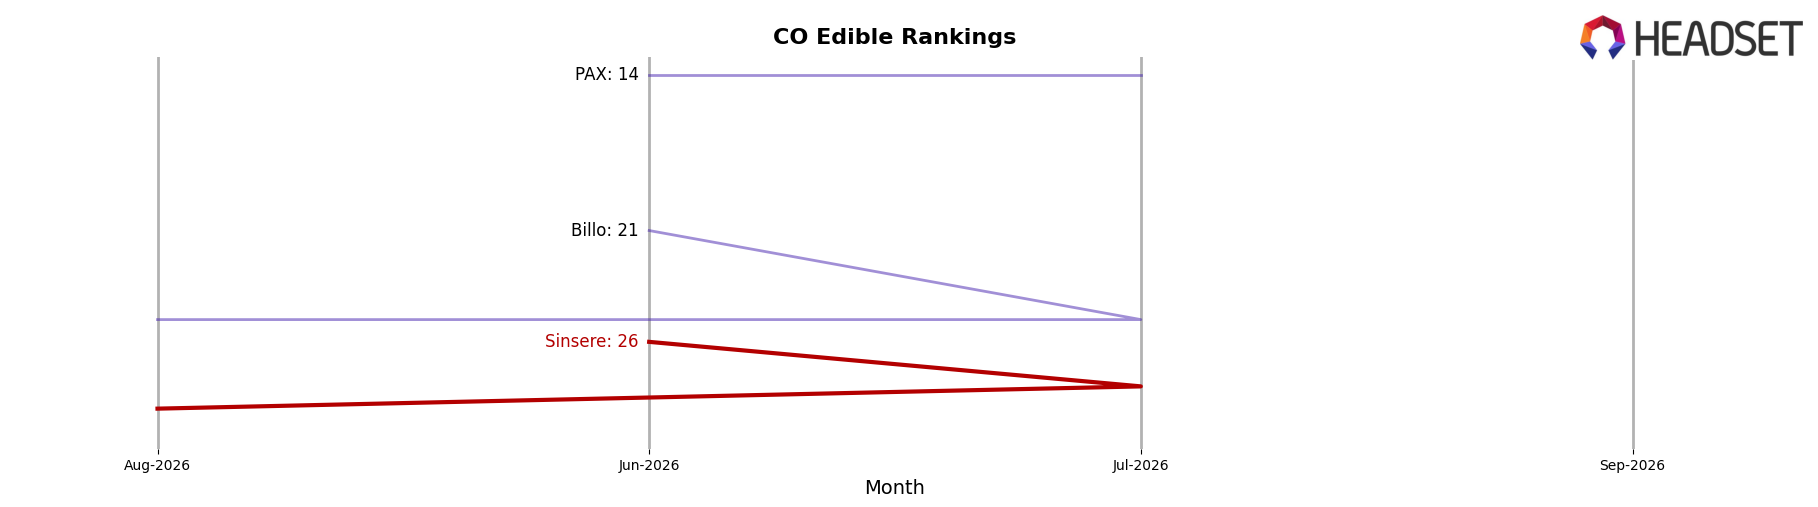
Sinsere ranks #37 in Colorado Edible for September 2026, down 11 positions year over year from #26, and 11 positions lower than its June 2026 rank of #26; this sits 15 places below its peak of #22 reached in November 2025. In contrast, Wana moved from #2 to #1 with a 10.5% YoY sales increase while Wyld slipped from #1 to #2 amid a 23.8% YoY sales decline, and Dialed In Gummies held #3 with 30.8% YoY growth; Sinsere’s drop from #26 to #37 alongside peers gaining or holding top-5 positions implies a shift from mid-tier relevance toward lower-tier visibility unless rank stabilization reverses.
Notable Products
Cookies and Milk Chocolate Bar 10-Pack (100mg) posted the steepest decline at -79.6% MoM while dropping to rank 5, as Salted Dark Chocolate Bar (100mg) also fell -58.5% MoM despite holding rank 1. In contrast, Irish Coffee and Cream Chocolate Bar (100mg) surged +70.7% MoM into rank 2, and Belgian Chocolate Coconut Pecan Bites 10-Pack (100mg) climbed +53.7% MoM to rank 4, indicating volatility concentrated within a few SKUs. With eight of the top ten being Edible chocolate formats, the mix points to Sinsere leaning into flavor experimentation and multipack formats even as flagship dark and novelty 10-packs cycle sharply.
Top Selling Cannabis Brands






Data for this report comes from real-time sales reporting by participating cannabis retailers via their point-of-sale systems, which are linked up with Headset’s business intelligence software. Headset’s data is very reliable, as it comes digitally direct from our partner retailers. However, the potential does exist for misreporting in the instance of duplicates, incorrectly classified products, inaccurate entry of products into point-of-sale systems, or even simple human error at the point of purchase. Thus, there is a slight margin of error to consider. Brands listed on this page are ranked in the top twenty within the market and product category by total retail sales volume.

