.svg)


Where to Buy
Slow Burn Farms is stocked at 29 licensed dispensaries across Colorado, with the deepest coverage in Denver, Colorado Springs, Durango, Grand Junction, and Edgewater. Search by ZIP code or city below to find the closest one, or filter by product type if you are after a specific format.
Market Insights Snapshot
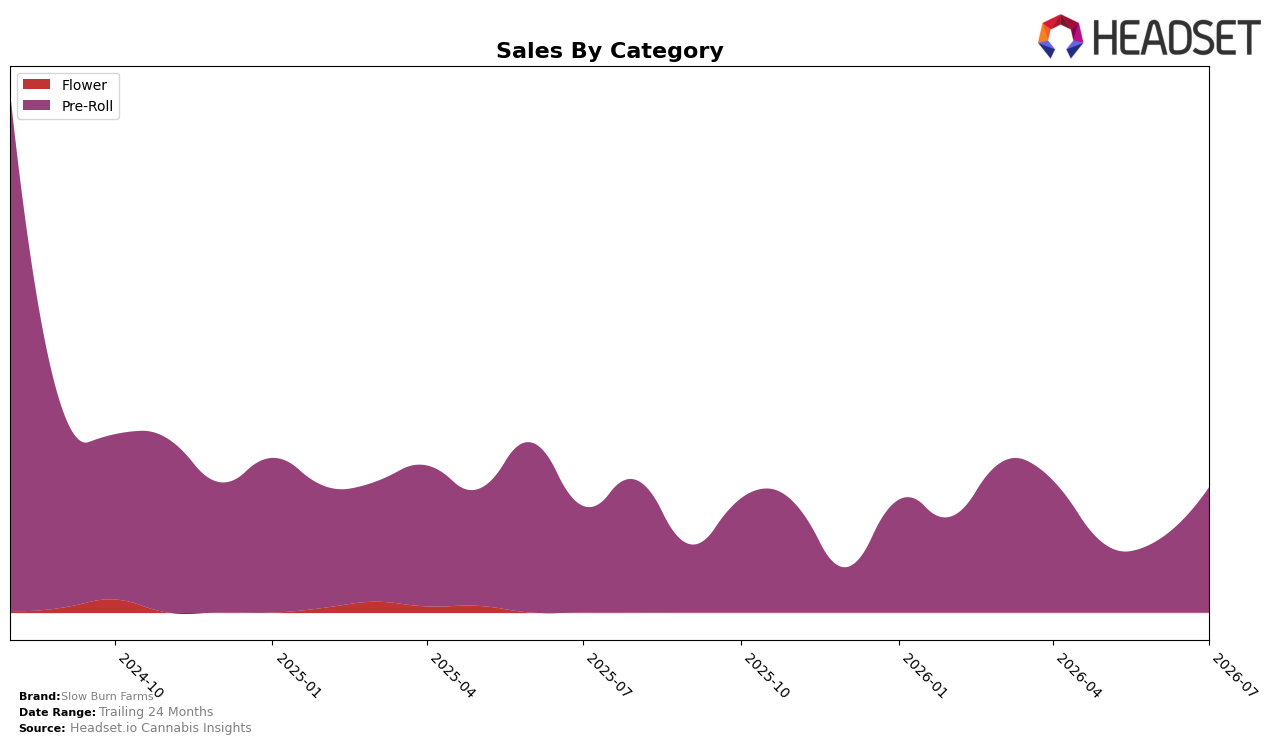
In July 2026, Slow Burn Farms operated as a single-category brand in Pre-Roll with 100.0% category mix, posting year-over-year sales growth of 17.6% alongside a month-over-month rise of 74.1%. Average price declined 9.0% year over year while the brand’s sales advanced 17.6%, and rank in Colorado Pre-Roll sat at position 45. The pattern implies volume expansion driven by lower unit pricing and concentration in a single category, which tightens near-term execution risk while creating a clear lever for incremental share capture if price elasticity holds.
The July 2026 mix—100.0% in Pre-Roll with a 74.1% month-over-month surge and a 17.6% year-over-year lift—paired with an average price that is 9.0% lower year over year, positions Slow Burn Farms as a value-forward Pre-Roll specialist rather than a diversified portfolio play. Being ranked 45 in Colorado Pre-Roll during a period where two-year sales are down 70.2% but the latest month inflected positive indicates a recovery path built on price-led velocity; the implication is that sustaining share gains will likely depend on maintaining sub-$6 pricing while selectively adding SKUs or formats to reduce overexposure to single-category swings.
Competitive Landscape
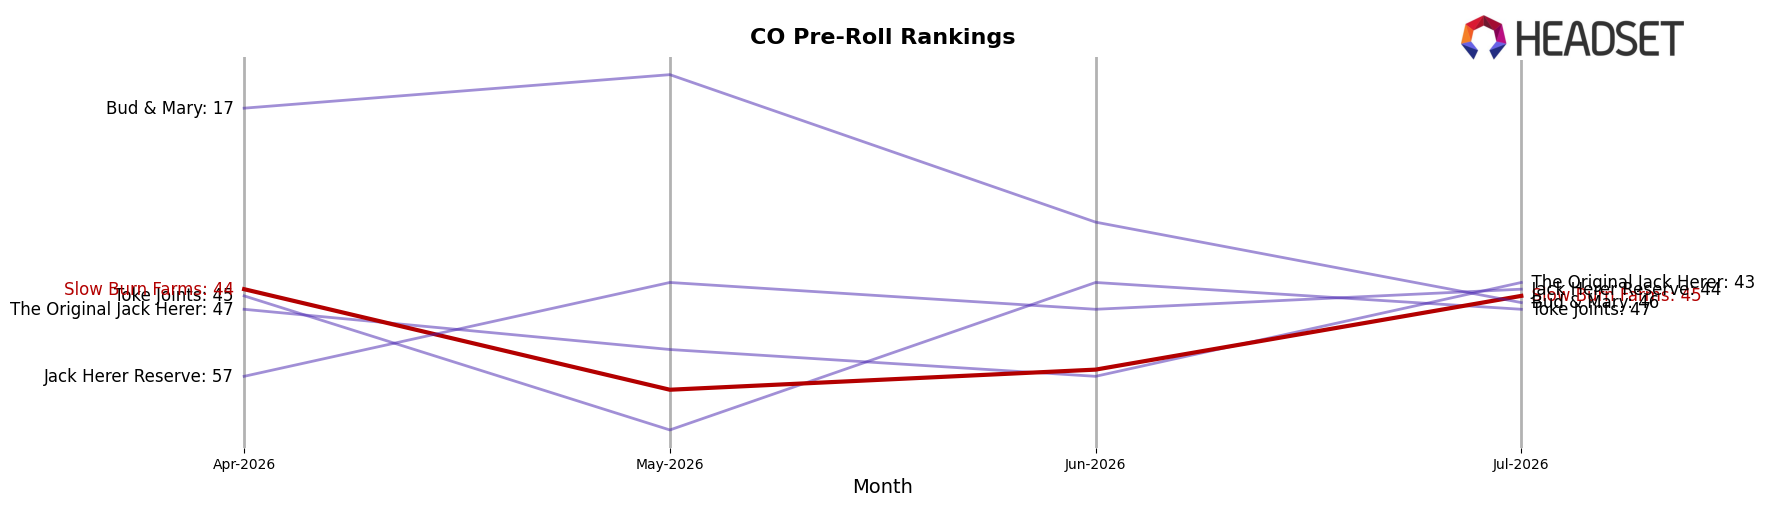
Slow Burn Farms sits at rank #45 in CO Pre-Roll for July 2026, improving 12 spots YoY from #57, while slipping 1 position from April 2026’s #44 and standing far below its peak of #16 in August 2024; in contrast, Green Dot Labs climbed from #3 to #1 with 92.8% YoY sales growth and TWAX jumped from #14 to #5 with 138.0% YoY growth, whereas Kaviar slid from #2 to #3 alongside a 17.7% YoY sales decline. This mixed trajectory—double-digit YoY rank gain but deterioration from an August 2024 peak and a near-term dip vs. April 2026—implies Slow Burn Farms is stabilizing mid-pack rather than re-accelerating toward prior top-20 positioning.
Notable Products
Tallymon Pre-Roll (1g) drove the month with a 965.7% MoM surge to rank 1, vaulting ahead of all other SKUs and indicating a rapid shift in consumer pull toward this format. Moon Raker Pre-Roll (1g) settled at rank 2 while 9 Lions Pre-Roll (1g) held rank 3, and Karamel Kut-Throat Pre-Roll (1g) dropped 40.7% to rank 9, creating a polarized spread between the top and lower tier. With nine of the top ten SKUs in the Pre-Roll category and only one SKU generating $11,233, the assortment is concentrating volume into a few winners rather than a broad base. The pattern implies Slow Burn Farms is leaning into a Pre-Roll-led strategy where a breakout hero drives traffic while trailing SKUs face pruning pressure.
Top Selling Cannabis Brands






Data for this report comes from real-time sales reporting by participating cannabis retailers via their point-of-sale systems, which are linked up with Headset’s business intelligence software. Headset’s data is very reliable, as it comes digitally direct from our partner retailers. However, the potential does exist for misreporting in the instance of duplicates, incorrectly classified products, inaccurate entry of products into point-of-sale systems, or even simple human error at the point of purchase. Thus, there is a slight margin of error to consider. Brands listed on this page are ranked in the top twenty within the market and product category by total retail sales volume.

