.svg)


Where to Buy
Soft Power Sweets is stocked at 103 licensed dispensaries across New York, with the deepest coverage in New York, Brooklyn, Binghamton, Hudson, and Newburgh. Search by ZIP code or city below to find the closest one.
Market Insights Snapshot
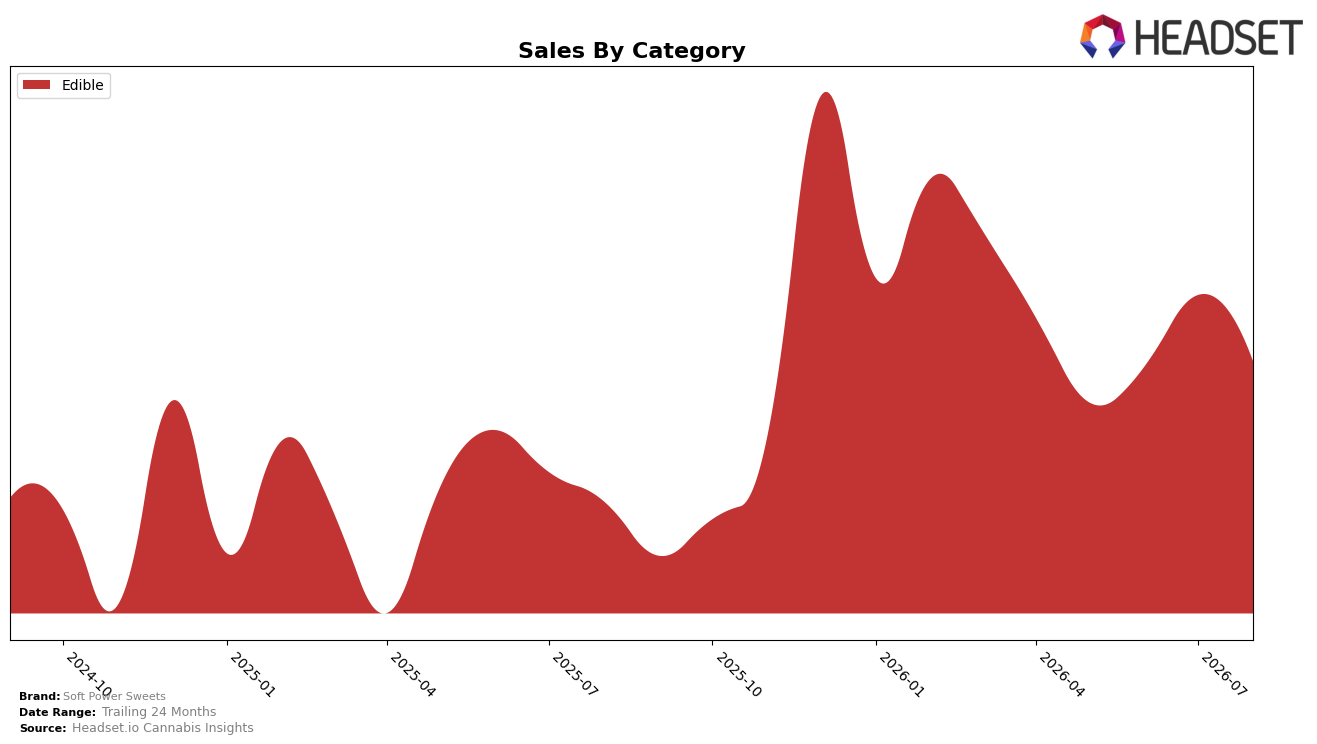
In August 2026, Soft Power Sweets concentrated entirely in Edible, with category share at 100.0% and a rank position of 29 in New York Edible. Within this single-category focus, year-over-year sales rose 29.5% while month-over-month sales fell 9.7%, and the average price declined 26.2% year-over-year to $16.31. The pattern implies a deliberate volume-led play in Edible that lifted annual momentum but created short-term drag in August 2026 as near-term pricing and seasonal pullback compressed monthly results.
The 29.5% year-over-year sales increase alongside a 26.2% price decrease suggests mix or pack-size tactics are expanding units while trimming realized price, and the 9.7% month-over-month contraction paired with a 100.0% category concentration leaves no buffer from Edible seasonality. Holding rank 29 in New York Edible while leaning into price elasticity indicates Soft Power Sweets is trading access for margin, implying its positioning skews toward value-driven Edible penetration rather than premium differentiation in August 2026.
Competitive Landscape
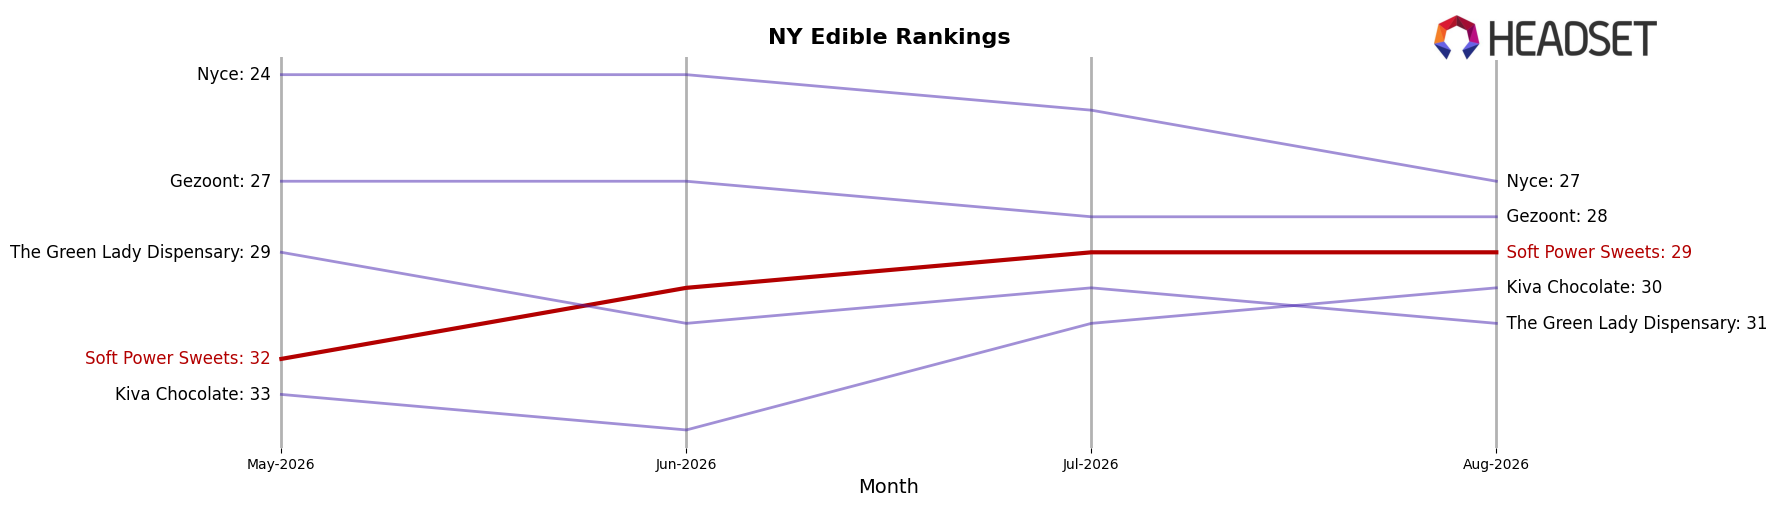
Soft Power Sweets sits at #29 in NY Edible in August 2026, improving 4 ranks from #33 year over year while down 2 positions from its March 2026 peak of #27; this mild climb contrasts with Off Hours slipping from #1 to #2 alongside a -24.8% sales YoY change, whereas Gron / Grön edged up from #4 to #3 with a +14.8% sales YoY gain. Against category leaders, Camino advanced from #2 to #1 with +10.5% sales YoY while Soft Power Sweets also improved from #33 to #29, indicating relative momentum but not the step-change seen among the top four; the pattern implies Soft Power Sweets’ rank trajectory is stabilizing in the upper-20s and will require sharper differentiation to break past the #27 ceiling observed in March 2026.
Notable Products
Loosies - CBD/CBG/THC 1:1:5 Orange Cream Gummies 10-Pack (20mg CBD, 20mg CBG, 100mg THC) posted the steepest decline at -26.8% while holding rank 3, a sharper drop than the -23.5% slide at rank 8 and the -31.7% plunge at rank 7 that together point to pressure on richer multi-cannabinoid and caramel formats. At the top, Loosies - CBD/THC 1:5 Sour Blue Raspberry Gummies 10-Pack (20mg CBD, 100mg THC) dipped -2.5% yet stayed rank 1, contrasting with the 9.5% MoM rise at rank 2 and an 8.7% lift at rank 4, indicating momentum is concentrating in fruit-forward gummies over chocolate variants. Eight of the top ten are Edible SKUs from the same Loosies and confection families, with declines of -19.7% at rank 5 and -26.5% at rank 9 alongside one bright spot near $8,356 in August 2026, implying Soft Power Sweets is tilting toward a gummy-led mix where stability at the top masks volatility in multi-cannabinoid and caramel sub-lines.
Top Selling Cannabis Brands






Data for this report comes from real-time sales reporting by participating cannabis retailers via their point-of-sale systems, which are linked up with Headset’s business intelligence software. Headset’s data is very reliable, as it comes digitally direct from our partner retailers. However, the potential does exist for misreporting in the instance of duplicates, incorrectly classified products, inaccurate entry of products into point-of-sale systems, or even simple human error at the point of purchase. Thus, there is a slight margin of error to consider. Brands listed on this page are ranked in the top twenty within the market and product category by total retail sales volume.

