Jun-2026
Sales
Trend
6-Month
Product Count
SKUs
Avg Price
YoY Sales Change
YoY Price Change
Market Insights Snapshot
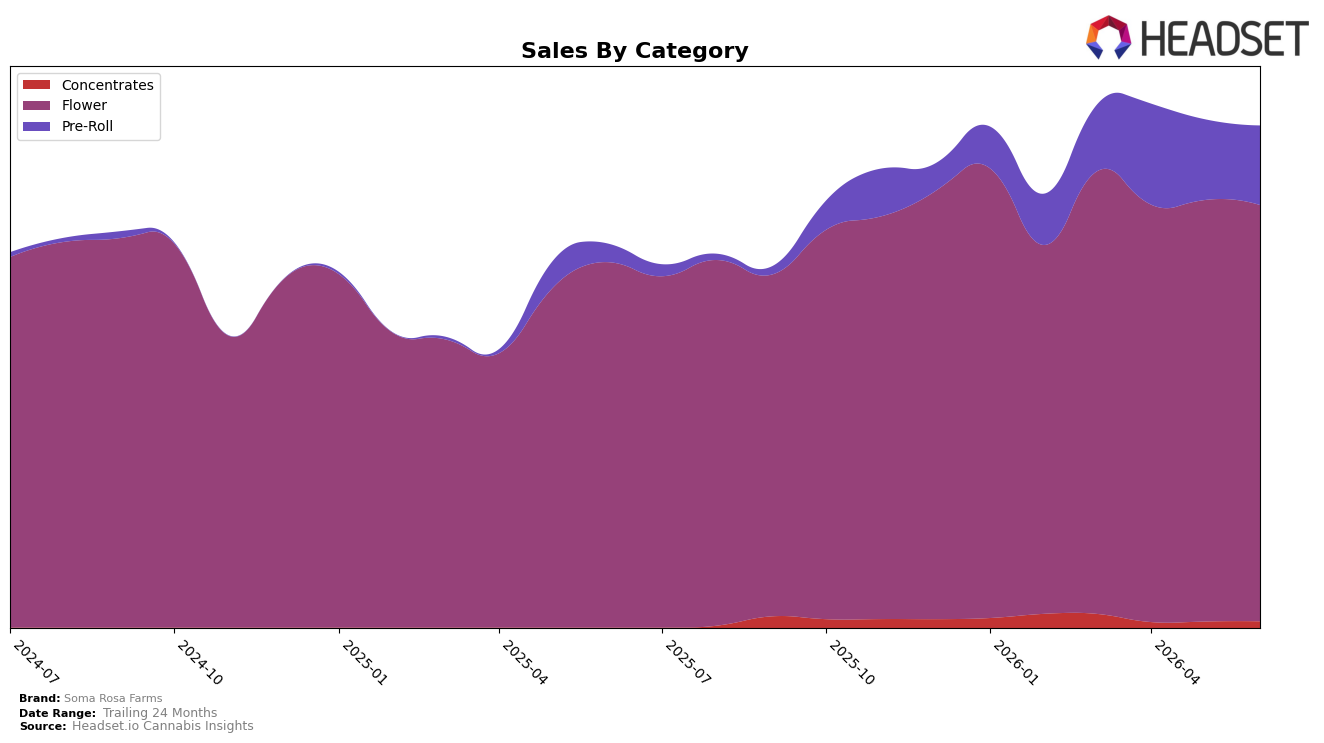
In June 2026, Soma Rosa Farms concentrated 82.97% of sales in Flower with a 13.96% year-over-year increase, while Pre-Roll held 15.79% share with a 336.72% year-over-year surge; month over month, Flower slipped 1.24% and Pre-Roll eased 1.58%. Concentrates remained a 1.24% share with a 4.01% month-over-month rise but lacked a reported year-over-year figure, and the overall average price fell 13.02% year over year to $23.82, contrasting with Flower’s higher $39.27 average and Pre-Roll’s $8.20. The pattern implies a deliberate tilt toward value-led volume in Pre-Rolls to complement a dominant but slightly softening Flower base, setting a mixed-price ladder that expands reach without overexposing the core category to monthly volatility.
These shifts position Soma Rosa Farms to compete on breadth within Flower while using rapid Pre-Roll expansion to capture price-sensitive demand, as indicated by the 336.72% year-over-year Pre-Roll growth alongside a 1.24% month-over-month dip in Flower and a 13.02% brand-wide price decline. Holding a 26th rank in Flower in California and sustaining 30.85% brand sales growth year over year suggests the brand’s distribution and assortment are lifting total volume even as Flower’s month-over-month softness persists; the implication is that near-term share gains will rely on continuing Pre-Roll penetration and stabilizing Flower velocity rather than pricing power.
Competitive Landscape
Soma Rosa Farms sits at rank #26 in CA Flower in June 2026, improving 9 positions from #35 year over year, but slipping 1 spot from #25 in March 2026 to #26 in June 2026; meanwhile, STIIIZY advanced from #2 to #1 year over year with 62.5% YoY sales growth and CAM climbed from #3 to #2 with 56.2% YoY growth, while CannaBiotix (CBX) fell from #1 to #3 despite positive 2.4% YoY growth; this pattern implies Soma Rosa Farms’ upward YoY rank momentum is present but outpaced by faster-moving leaders, signaling a need to convert proximity to its March 2026 peak rank of #25 into sustained share gains against competitors accelerating into the top 5.

Notable Products
Chem Dawg Pre-Roll (1g) posted the standout move in June 2026 with a 126% month-over-month increase to rank 4, while Pink Certz Pre-Roll (1g) also surged 58% to hold rank 1, implying momentum is concentrated at the very top of the lineup. With five of the top six and seven of the top ten coming from the Pre-Roll category, the portfolio is skewing toward ready-to-smoke formats over Flower, even as Glitter Bomb (3.5g) sits at rank 8 with $17,044 in sales. The concentration of gains in two Pre-Roll SKUs alongside a cluster of static Flower entries at ranks 8–10 suggests the mix is tilting toward rapid-turn, single-gram Pre-Rolls as the commercial priority.
Top Selling Cannabis Brands
Data for this report comes from real-time sales reporting by participating cannabis retailers via their point-of-sale systems, which are linked up with Headset’s business intelligence software. Headset’s data is very reliable, as it comes digitally direct from our partner retailers. However, the potential does exist for misreporting in the instance of duplicates, incorrectly classified products, inaccurate entry of products into point-of-sale systems, or even simple human error at the point of purchase. Thus, there is a slight margin of error to consider. Brands listed on this page are ranked in the top twenty within the market and product category by total retail sales volume.

