Jun-2026
Sales
Trend
6-Month
Product Count
SKUs
Avg Price
YoY Sales Change
YoY Price Change
Market Insights Snapshot
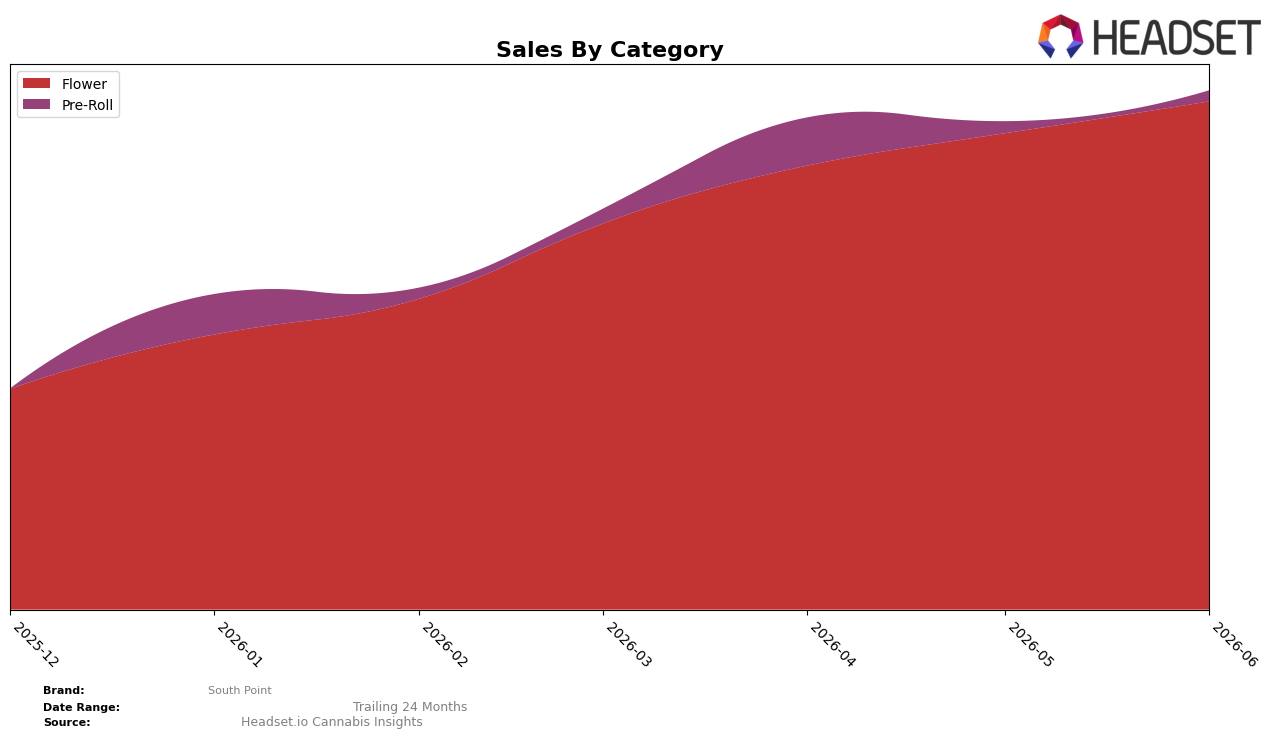
South Point’s category mix in June 2026 is concentrated in Flower at 86.93% share with a month-over-month change of +5.75%, while Pre-Roll holds 13.07% share with a -0.97% MoM shift; the average Flower price sits at $40.81 versus $21.72 for Pre-Roll, creating a pricing gap of 88% that widens with the Flower MoM uplift. In Ontario, this tilt toward Flower implies reliance on a single demand stream, and the brand’s Flower rank of 22 in Alberta suggests mid-pack visibility that could either improve if the +5.75% MoM momentum persists or erode if the -0.97% Pre-Roll drag expands.
The mix shift—Flower gaining share while Pre-Roll recedes—signals a positioning anchored to higher-priced core SKUs, as the $40.81 average in Flower supports premium-per-unit revenue while the $21.72 Pre-Roll price reduces downside if value buyers exit. With 86.93% of sales tied to Flower and a 22nd rank in Alberta Flower, South Point’s near-term path is to convert the +5.75% MoM trend into rank gains by increasing depth in winning Flower segments while capping exposure to the -0.97% MoM Pre-Roll softness, implying a deliberate focus on efficiency over breadth.
Competitive Landscape
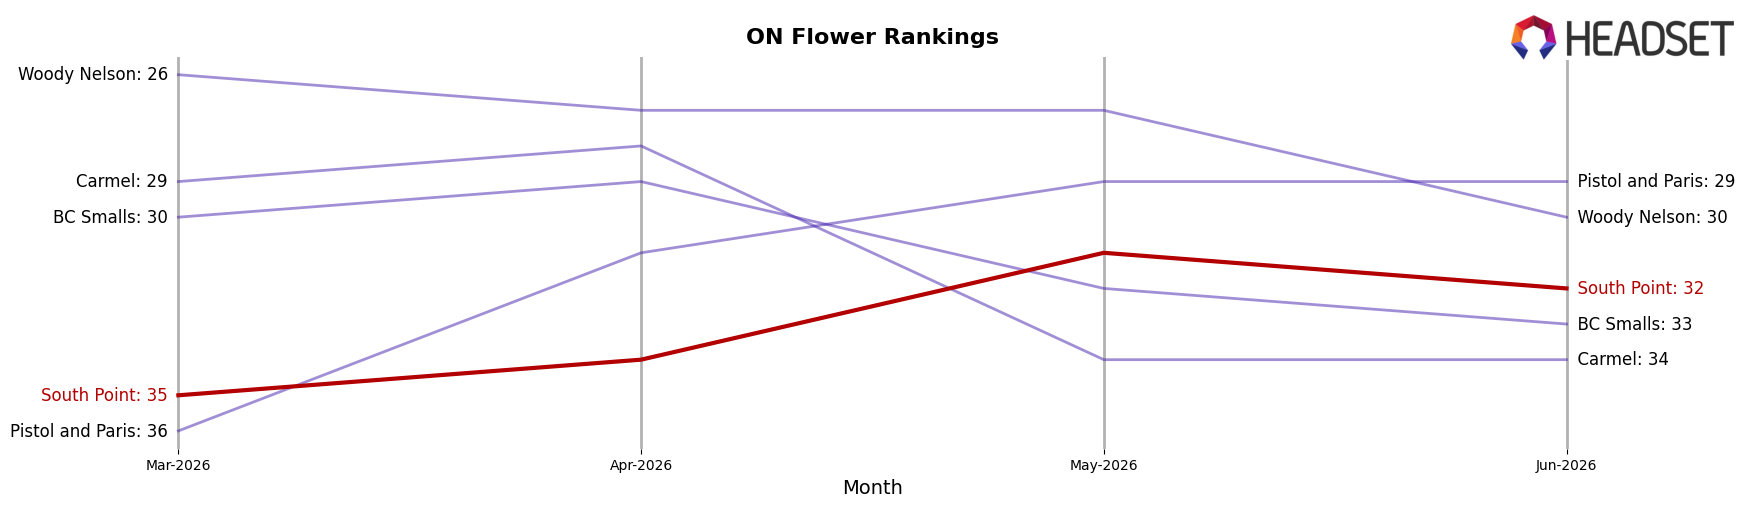
South Point sits at rank #32 in ON Flower in June 2026, improving 3 positions from #35 in March 2026, while its peak rank of #31 in May 2026 places the current month 1 spot off its recent high; in contrast, Spinach holds #1 after a 4-position YoY climb and Back Forty / Back 40 Cannabis is #4 with a -11.25% YoY sales change. The gap to the top cluster is widening as Shred is #2 with a 2-position YoY gain and The Original Fraser Valley Weed Co. is #5 after jumping 8 ranks YoY, which, paired with South Point’s 1-rank slip from its May 2026 peak and only a 3-rank improvement versus March 2026, implies a stabilizing mid-pack trajectory that requires sharper share capture to avoid being outpaced.
Notable Products
Turbo Diesel (3.5g) posted the steepest decline at -17.7% month over month while holding rank 1, whereas Turbo Diesel (14g) rose +25.4% to rank 2, creating a size-tier divergence at the top of the lineup. Turbo Diesel Pre-Roll 5-Pack (2.5g) slipped -1.0% at rank 3, and two of the top three SKUs are Flower variants, concentrating share in a single category while the Pre-Roll lags in momentum. With Flower anchoring both rank 1 and rank 2 and only one format showing growth, the mix signals South Point is tilting toward larger pack sizes over smaller units despite the 3.5g drawdown, implying a push to value-driven volume rather than breadth of formats.
Top Selling Cannabis Brands
Data for this report comes from real-time sales reporting by participating cannabis retailers via their point-of-sale systems, which are linked up with Headset’s business intelligence software. Headset’s data is very reliable, as it comes digitally direct from our partner retailers. However, the potential does exist for misreporting in the instance of duplicates, incorrectly classified products, inaccurate entry of products into point-of-sale systems, or even simple human error at the point of purchase. Thus, there is a slight margin of error to consider. Brands listed on this page are ranked in the top twenty within the market and product category by total retail sales volume.

