Jun-2026
Sales
Trend
6-Month
Product Count
SKUs
Avg Price
YoY Sales Change
YoY Price Change
Market Insights Snapshot
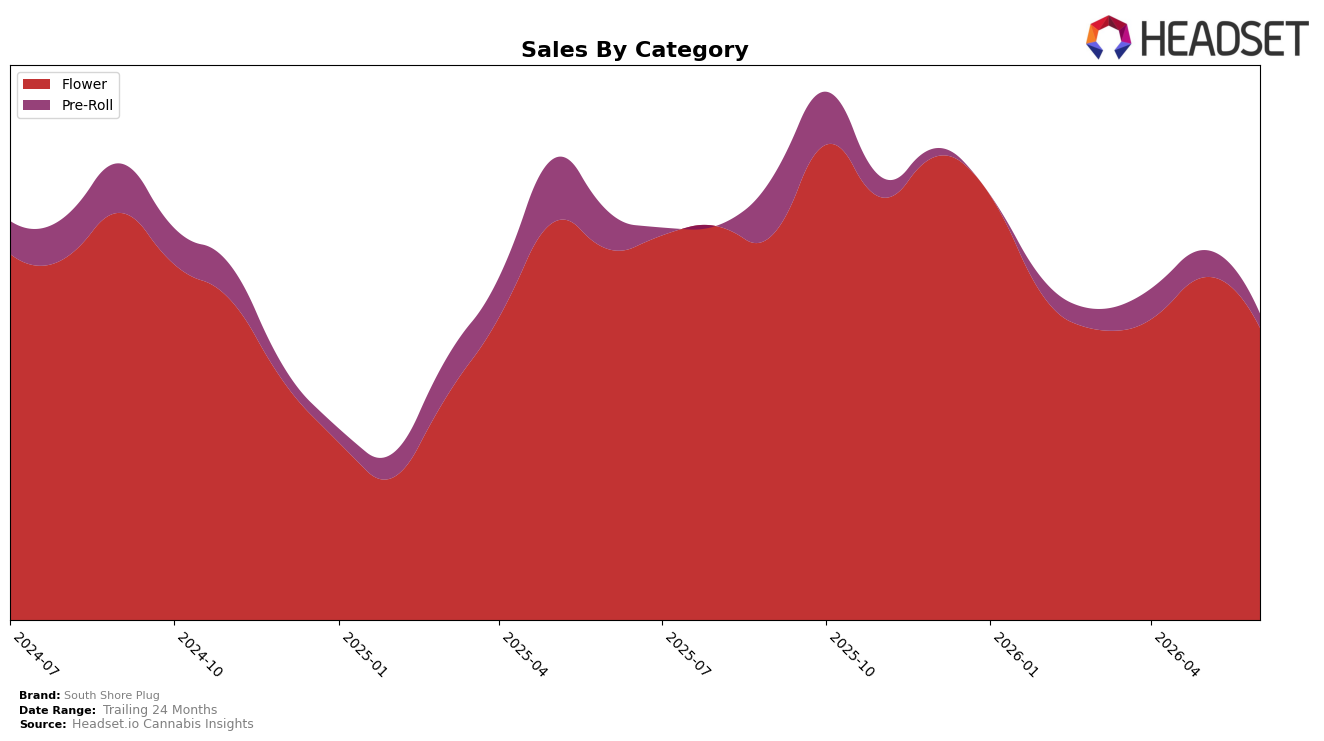
In June 2026, South Shore Plug’s mix concentrated 94.02% in Flower and 5.98% in Pre-Roll, while Flower declined 20.98% year over year and 14.59% month over month and Pre-Roll fell 55.08% year over year and 40.25% month over month. Average price slipped 0.75% year over year to $9.84, with Flower averaging $10.63 and Pre-Roll at $4.54, and Flower’s rank in Massachusetts stood at 11. The pattern implies overexposure to a contracting Flower base where double‑digit month-over-month erosion pairs with limited pricing relief, compressing overall velocity despite a concentrated category bet.
The 94.02% Flower reliance alongside a 14.59% month-over-month volume slide and an 11th-place category rank suggests limited insulation from category shocks and few share‑defending levers. With Pre-Roll shrinking 40.25% month over month and 55.08% year over year at a much lower average ticket, the portfolio lacks a counterweight to Flower’s 20.98% year-over-year decline, implying South Shore Plug’s near‑term positioning hinges on stabilizing Flower throughput in Massachusetts rather than expecting mix-driven cushion.
Competitive Landscape
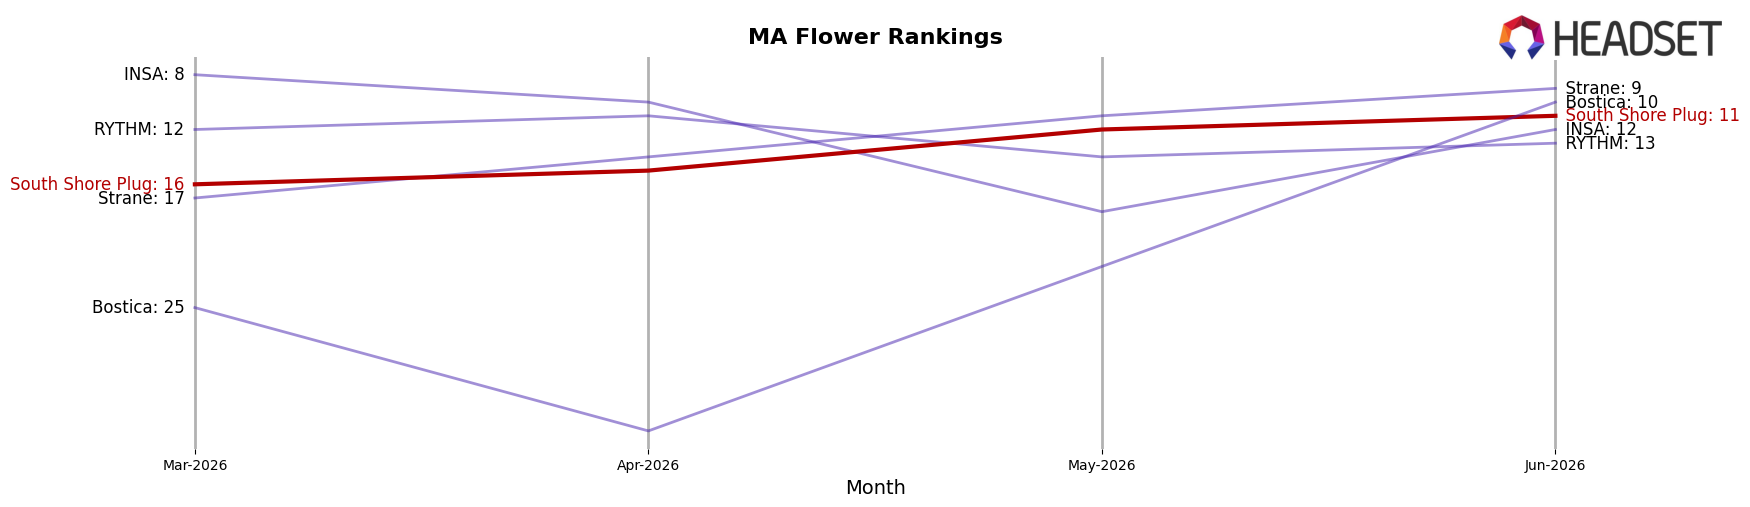
South Shore Plug sits at rank #11 in MA Flower in June 2026, improving 2 positions year over year from #13 and climbing 5 spots since March 2026 from #16, while still 3 places shy of its January 2026 peak at #8; in the same period, Farmer's Cut advanced from #3 to #1 with sales up 32.4% YoY and Root & Bloom jumped from #16 to #5 with 158.9% YoY growth, indicating competitors are accelerating rank gains faster than a 2-position YoY rise for South Shore Plug. The combination of a 5-rank quarter-on-quarter improvement and a smaller 2-position YoY lift implies a mid-pack rebound driven by recent momentum rather than sustained category share capture.
Notable Products
Street Tartz Pre-Roll (1g) posted the steepest movement in June 2026 with a -54.36% month-over-month decline and sat at rank 9, while GG4 (3.5g) fell -35.56% to rank 2. In contrast, Joker OG (3.5g) gained 12.59% and held rank 1, creating a widening spread between the top Flower leader and weakening Pre-Roll entries. Four of the top ten are Flower SKUs occupying ranks 1, 2, 4, 5, 6, 8, and 10 collectively, versus three Pre-Rolls at ranks 3, 7, and 9, and this tilt implies a pivot toward Flower-led velocity as Pre-Rolls retrench.
Top Selling Cannabis Brands
Data for this report comes from real-time sales reporting by participating cannabis retailers via their point-of-sale systems, which are linked up with Headset’s business intelligence software. Headset’s data is very reliable, as it comes digitally direct from our partner retailers. However, the potential does exist for misreporting in the instance of duplicates, incorrectly classified products, inaccurate entry of products into point-of-sale systems, or even simple human error at the point of purchase. Thus, there is a slight margin of error to consider. Brands listed on this page are ranked in the top twenty within the market and product category by total retail sales volume.

