Market Insights Snapshot
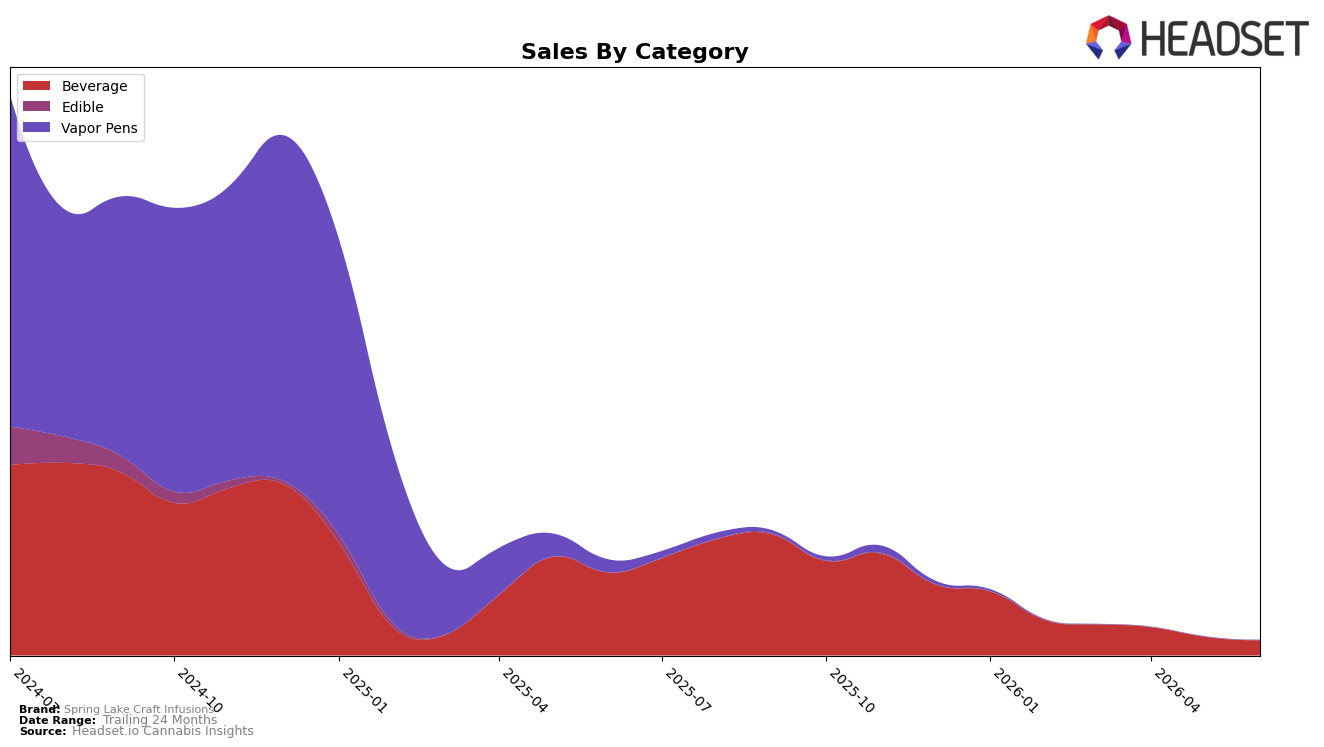
In June 2026, Spring Lake Craft Infusions operated as a single-category brand with Beverage accounting for 100.0% of sales, while overall brand sales fell 84.3% year over year and Beverage-specific sales declined 81.9% year over year. Month over month, Beverage contracted 18.7% alongside a 14.6% year-over-year decrease in average price, with the current average price at $14.49. The concentration in one category amplifies volatility; the simultaneous 81.9% YoY and 18.7% MoM declines indicate demand compression outpacing pricing relief, implying that June 2026 dynamics reflect a reliance on Beverage that is not cushioning broader brand contraction.
The full reliance on Beverage in Illinois positions Spring Lake Craft Infusions as a niche player whose exposure is driven by one product format, with an 81.9% YoY category decline and an 18.7% MoM drop signaling limited cross-category offsets. With average price down 14.6% year over year while sales slid 84.3%, the elasticity signal points to share dilution rather than price-led volume recovery, implying that the brand’s positioning in June 2026 is skewed toward defending a shrinking core rather than leveraging diversification or premiumization.
Competitive Landscape
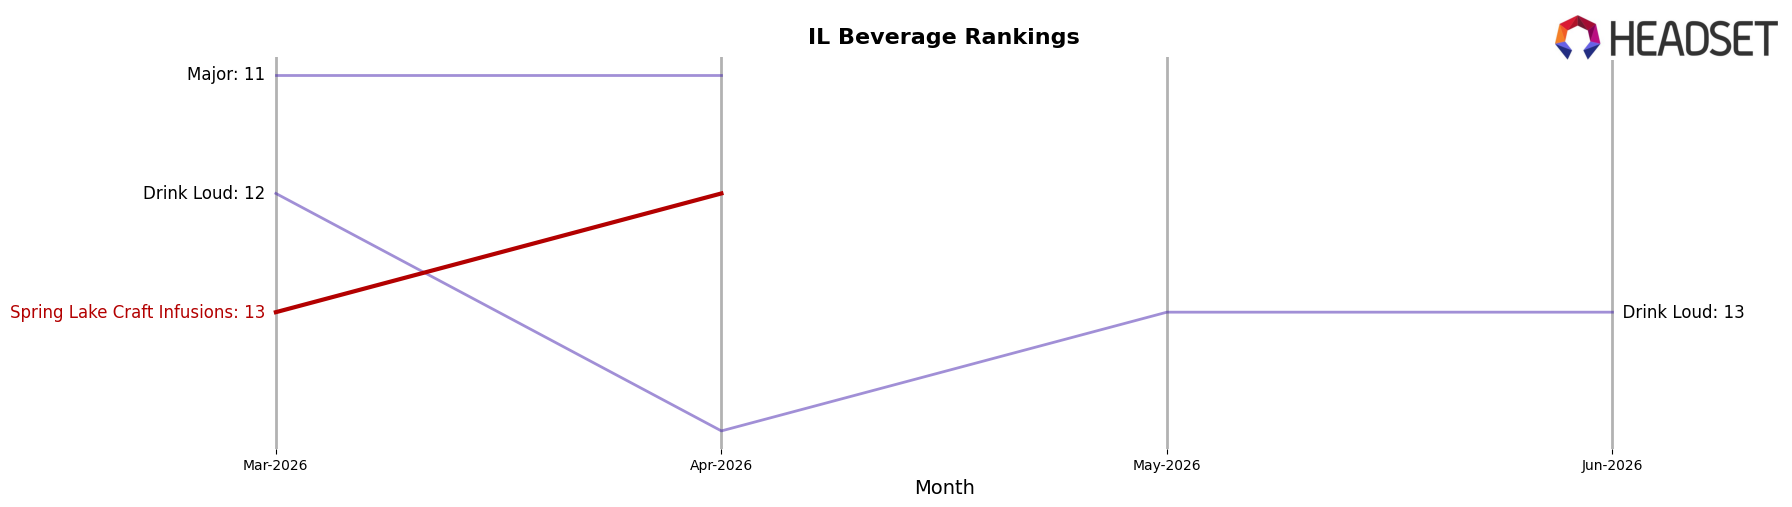
Spring Lake Craft Infusions sits at rank #16 in IL Beverage in June 2026, down 7 positions year over year from #9, and 3 spots lower than its March 2026 position at #13; by contrast, Uncle Arnie's held #1 both this year and last despite a -30.5% YoY sales change, while Daze Off climbed from #4 to #3 alongside a 51.0% YoY sales increase. The brand is now 11 places below its August 2024 peak at #5 and trails Journeyman at #2, whose 29.5% YoY sales growth contrasts with Spring Lake Craft Infusions’ downward rank drift; the pattern implies that mix and velocity are lagging category leaders, and without reversing the 7-rank YoY slide, Spring Lake Craft Infusions risks ceding distribution to faster-rising rivals.
Notable Products
The steepest movement came from Berry x Blueberry Clementine Live Rosin Surp Syrup (100mg THC, 50ml), which fell 62.0% month over month to rank 4, while Cherry Limeade Surp Syrup (100mg THC, 50ml) declined 26.4% at rank 2. In contrast, Mimosa x Cookie Dos Live Rosin Surp Syrup (100mg THC, 50ml, 1.6oz) jumped 200.0% to rank 8, and Mimosa Rosin Surp Syrup (100mg) rose 38.5% at rank 7. With six of the top seven positions held by Beverage syrups and the top SKU, Mimosa Live Rosin Syrup 10-Pack (100mg), slipping 1.8% at rank 1, the mix points to a portfolio tilting toward flavor novelty within a concentrated Beverage lineup, implying experimentation is displacing a few legacy flavors without yet unseating the leader.
Top Selling Cannabis Brands
Data for this report comes from real-time sales reporting by participating cannabis retailers via their point-of-sale systems, which are linked up with Headset’s business intelligence software. Headset’s data is very reliable, as it comes digitally direct from our partner retailers. However, the potential does exist for misreporting in the instance of duplicates, incorrectly classified products, inaccurate entry of products into point-of-sale systems, or even simple human error at the point of purchase. Thus, there is a slight margin of error to consider. Brands listed on this page are ranked in the top twenty within the market and product category by total retail sales volume.

