.svg)
Sep-2026
Sales
Trend
6-Month
Product Count
SKUs
Avg Price
YoY Sales Change
YoY Price Change


Where to Buy
Stone Road is stocked at 140 licensed dispensaries across New York, New Mexico, and 2 other states, 81 of them in New York, with the deepest coverage in New York, Brooklyn, Queens, The Bronx, and Hudson. Search by ZIP code or city below to find the closest one, or filter by product type if you are after a specific format.
Market Insights Snapshot
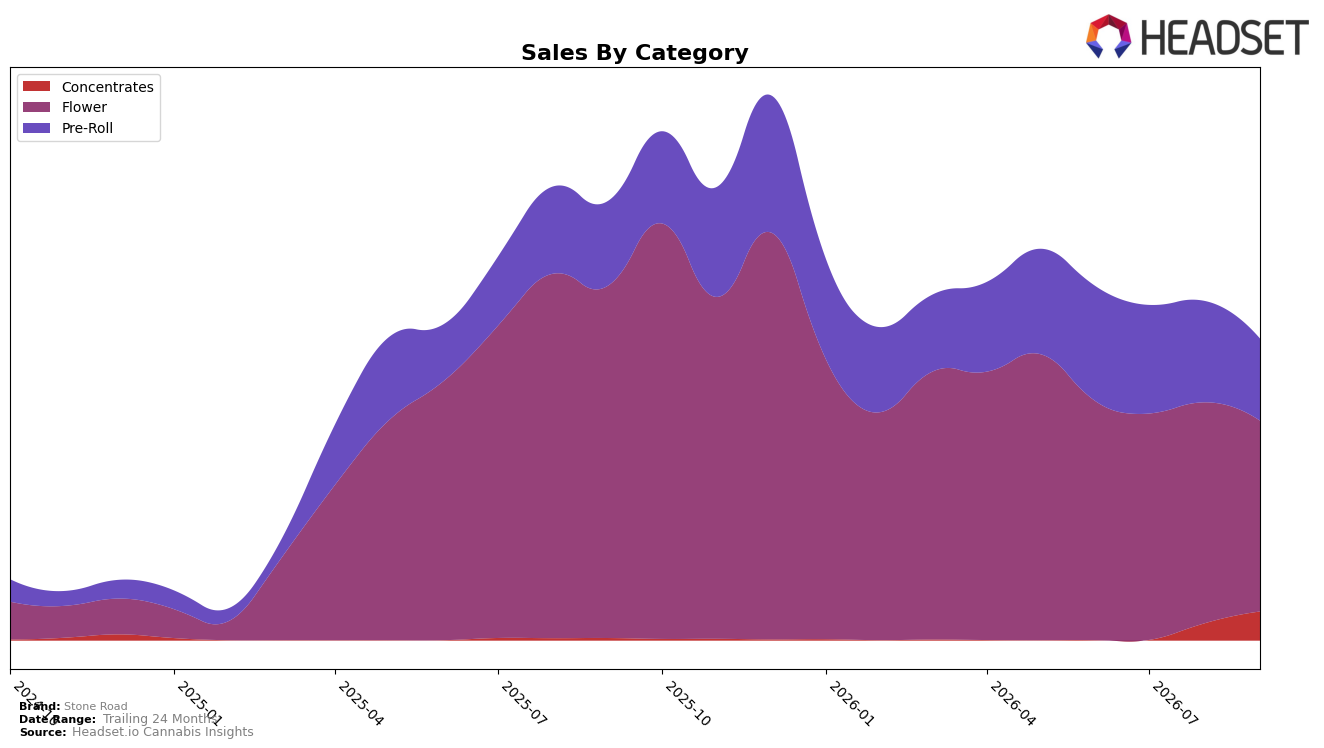
Stone Road’s category mix in September 2026 tilts heavily to Flower at 63.27% share, yet Flower sales fell 45.91% year over year and 13.66% month over month, while average brand price declined 12.92% YoY alongside a brand-level sales contraction of 31.40% YoY. Pre-Roll holds 27.17% share with a 3.10% YoY dip and a steeper 19.05% MoM decline, whereas Concentrates climbed to 9.56% share on a 1,176.90% YoY surge and 69.34% MoM growth; against this mix, Stone Road sits at rank 45 in Flower in New York. The pattern implies overexposure to a shrinking Flower base (rank 45 and −45.91% YoY) while gains in Concentrates are too small in absolute share to offset MoM drag from Pre-Roll (−19.05% MoM) and Flower (−13.66% MoM).
With Flower dominance at 63.27% alongside a −45.91% YoY drop and rank 45 in New York, Stone Road’s positioning is anchored in a lower-ranked, contracting primary category, while the 27.17% Pre-Roll share softens YoY pressure (−3.10%) but accelerates MoM weakness (−19.05%). The rapid Concentrates expansion (+1,176.90% YoY and +69.34% MoM) lifts mix to only 9.56%, indicating that near-term stability depends on reallocating from Flower and Pre-Roll toward Concentrates or reshaping price-pack architecture, because current share weights amplify downside when the two largest categories contract simultaneously.
Competitive Landscape
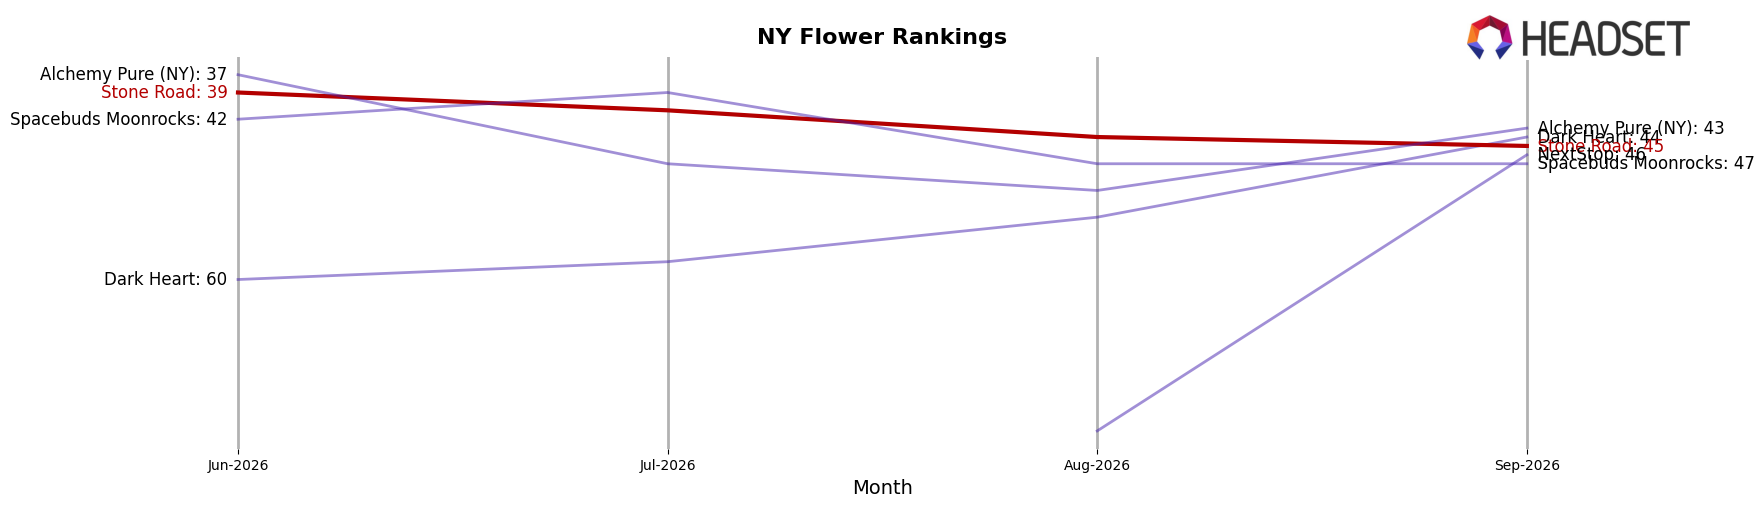
Stone Road sits at rank 45 in New York Flower in September 2026, sliding 19 positions year over year from rank 26 while also dropping 6 positions since June 2026 from rank 39; against this backdrop, Find. advanced to rank 1 with a 5-position YoY climb and 16.2% YoY sales growth, and Grassroots moved to rank 2 with a 15-position YoY climb and 150.3% YoY sales growth, indicating that Stone Road’s decline from a peak rank of 20 in October 2025 to 45 now coincides with faster upward mobility by top-tier rivals, implying that without a reversal in rank momentum Stone Road will continue to cede share to brands accelerating by double-digit percentage gains.
Notable Products
Space Cake Infused Pre-Roll (1g) posted the steepest contraction in September 2026 with a -50.8% month-over-month change while sliding to rank 9, whereas Banana Do-Si-Dos Infused Pre-Roll (1g) rose 47.9% MoM but held at rank 4. Traditional Charas Hash (1g) surged 54.6% MoM to rank 1, outpacing declining Flower leaders as Sweet Mango Dream Infused Pre-Ground (14g) fell -20.7% at rank 2. Four of the top ten are Pre-Roll SKUs, with two in decline at -32.6% and -50.8% and one near +48%, signaling a bifurcated Pre-Roll trajectory as Concentrates take the lead. The mix implies Stone Road is tilting toward higher-potency or differentiated formats, with Concentrates strength offsetting broad Flower softness and volatile Pre-Roll performance.
Top Selling Cannabis Brands






Data for this report comes from real-time sales reporting by participating cannabis retailers via their point-of-sale systems, which are linked up with Headset’s business intelligence software. Headset’s data is very reliable, as it comes digitally direct from our partner retailers. However, the potential does exist for misreporting in the instance of duplicates, incorrectly classified products, inaccurate entry of products into point-of-sale systems, or even simple human error at the point of purchase. Thus, there is a slight margin of error to consider. Brands listed on this page are ranked in the top twenty within the market and product category by total retail sales volume.

