Market Insights Snapshot
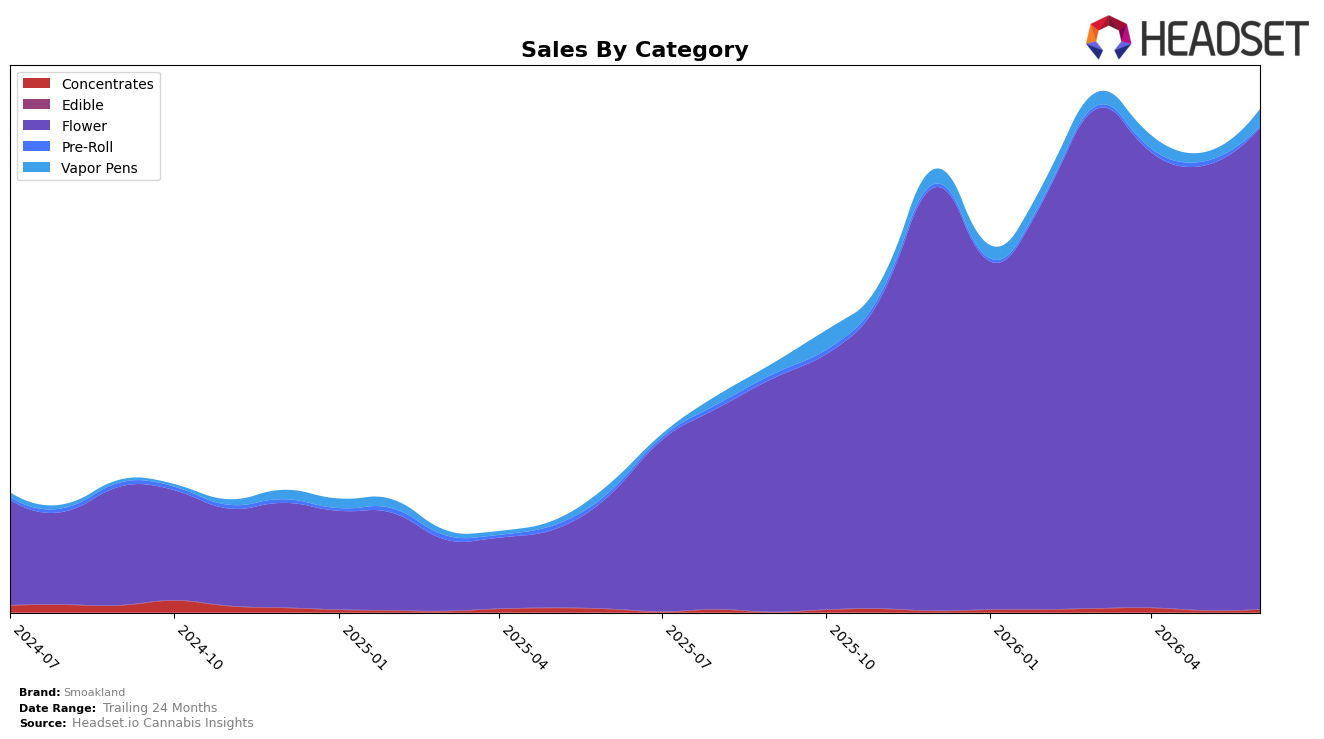
Smoakland concentrated 95.87% of June 2026 sales in Flower, up 8.21% month over month and 329.79% year over year, while Vapor Pens reached 3.35% share with a 95.24% MoM surge and 123.19% YoY growth; by contrast, Concentrates held 0.53% share with 69.90% MoM growth but a 13.44% YoY decline, and Pre-Roll slipped to 0.26% share with a 66.43% MoM drop and 56.49% YoY decline. The category skew coincided with an 81.26% YoY rise in average price to one dollar value ($65.92), and a brand-level 299.93% YoY sales lift, implying that June 2026 momentum is driven by premiumized Flower while smaller categories serve as volatile test beds rather than stable volume pillars.
Positioning-wise, a 95.87% Flower dependence alongside a rank of 9 in Flower in New York places Smoakland in a narrow but scalable lane: the 8.21% MoM Flower growth sustains immediate ranking relevance, yet the 95.24% MoM Vapor Pens spike and 69.90% MoM Concentrates increase indicate early traction in adjacent formats that could hedge risk if Flower growth normalizes. The simultaneous 56.49% YoY and 66.43% MoM declines in Pre-Roll, paired with the 81.26% YoY price escalation, suggest deliberate trade-up behavior rather than broad-based assortment expansion, implying that Smoakland’s near-term leverage is depth in Flower with selective, price-sensitive experimentation in inhalable adjacencies.
Competitive Landscape
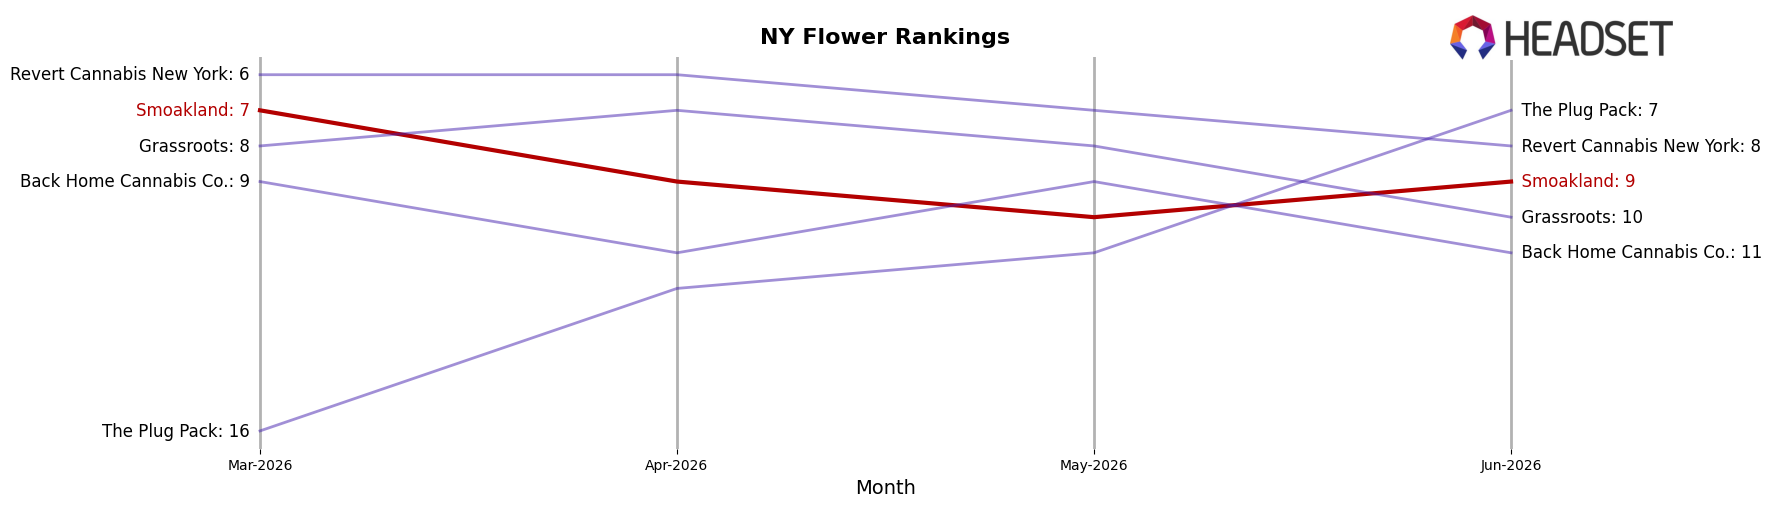
Smoakland ranks #9 in New York Flower in June 2026, improving 41 places year over year from #50 but slipping 2 positions from #7 in March 2026, which indicates a rebound on a long horizon but a short-term loss of momentum. While Smoakland moved from #7 to #9 over the last three months, Find. climbed from #3 year over year to #1 currently and RYTHM advanced from #10 year over year to #5, suggesting share consolidation at the top even as Smoakland hovers below its peak rank; this trajectory implies Smoakland must convert its year-over-year recovery into quarter-over-quarter gains to avoid being locked out of the top 5.
Notable Products
Exclusive - Blue Cookies (28g) set the tone in June 2026 with a -40.8% month-over-month drop and a slide to rank 8, while OG Kush Shake (28g) fell -21.0% to rank 6, signaling pressure on value-oriented Flower. In contrast, Pineapple Express (28g) climbed +47.8% to rank 4 and Maui Wowie (28g) rose +34.4% to hold rank 1, concentrating momentum at the top while mid-pack SKUs softened. With nine of the top ten in Flower and three SKUs in the top four gaining double digits, the mix implies Smoakland is leaning into higher-velocity, full-ounce Flower while pruning underperforming variants rather than broadening into other categories.
Top Selling Cannabis Brands
Data for this report comes from real-time sales reporting by participating cannabis retailers via their point-of-sale systems, which are linked up with Headset’s business intelligence software. Headset’s data is very reliable, as it comes digitally direct from our partner retailers. However, the potential does exist for misreporting in the instance of duplicates, incorrectly classified products, inaccurate entry of products into point-of-sale systems, or even simple human error at the point of purchase. Thus, there is a slight margin of error to consider. Brands listed on this page are ranked in the top twenty within the market and product category by total retail sales volume.

