.svg)

Sep-2026
Sales
Trend
6-Month
Product Count
SKUs
Avg Price
YoY Sales Change
YoY Price Change


Where to Buy
Artizen Cannabis is stocked at 133 licensed dispensaries across Washington and California, 124 of them in Washington, with the deepest coverage in Seattle, Tacoma, Spokane, Everett, and Olympia. Search by ZIP code or city below to find the closest one, or filter by product type if you are after a specific format.
Market Insights Snapshot
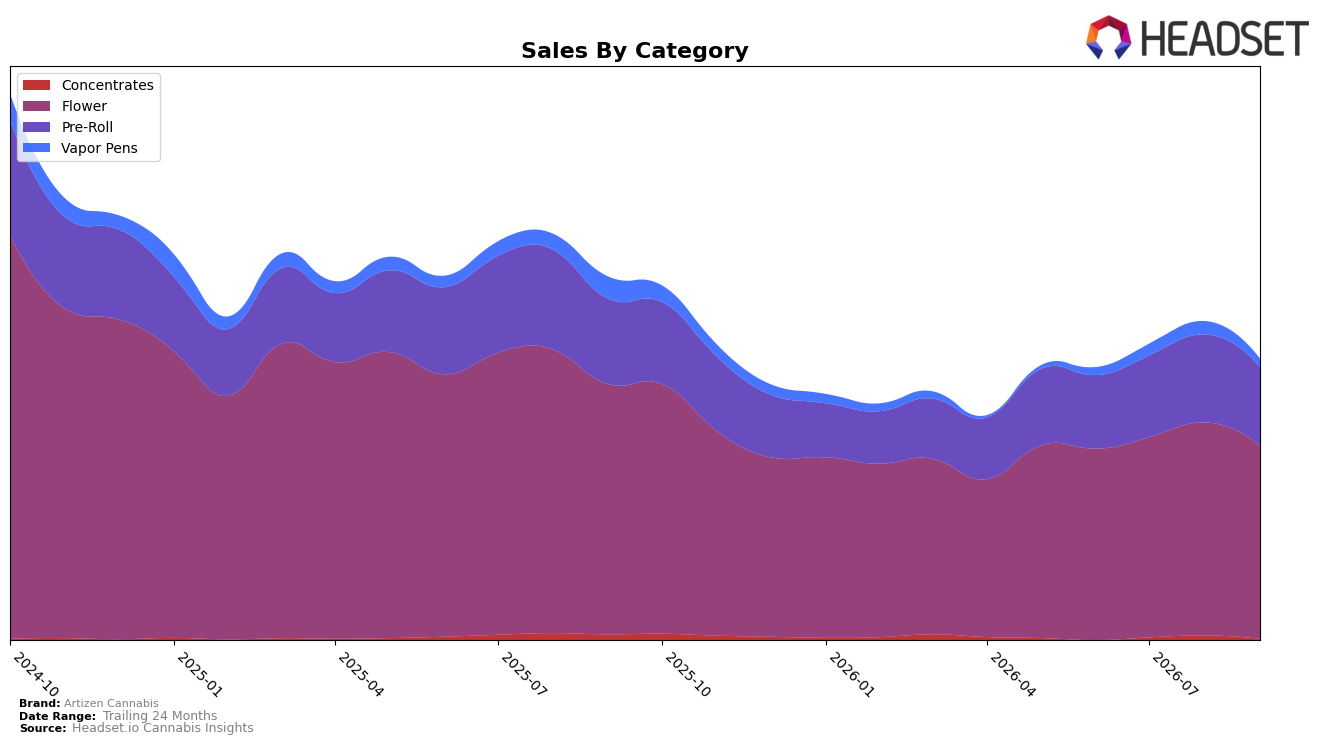
Artizen Cannabis concentrated 68.35% of September 2026 sales in Flower with year-over-year decline of 22.76% and month-over-month decline of 9.30%, while Pre-Roll held 27.92% share with a smaller year-over-year drop of 7.82% but a sharper month-over-month dip of 10.49%. Vapor Pens contracted to 3.07% share with year-over-year down 61.33% and month-over-month down 36.45%, and Concentrates fell to 0.66% share with year-over-year down 70.77% and month-over-month down 64.51%. With overall brand sales down 22.47% year over year and average price down 3.49%, the mix skews toward lower-priced formats even as the core Flower category softens, implying margin pressure alongside a reliance on Flower and Pre-Roll volume to offset severe declines in inhalable subcategories.
Within Washington Flower, Artizen Cannabis sits at rank 12, and the 9.30% month-over-month contraction in Flower alongside a 10.49% month-over-month decline in Pre-Roll suggests mid-pack positioning that is vulnerable if price reductions continue. The deep retrenchment in Vapor Pens (down 61.33% year over year) and Concentrates (down 70.77% year over year) leaves fewer premium or differentiated entry points, which, combined with a 22.47% brand-level year-over-year pullback, implies a strategy shift is needed toward stabilizing core Flower while selectively rebuilding small-format or value-led Pre-Roll to defend rank 12 and reduce exposure to the most volatile categories.
Competitive Landscape
Artizen Cannabis sits at rank 12 in WA Flower in September 2026, down 5 positions year over year from rank 7, with a 2-position lift from rank 14 three months ago; the brand’s peak of rank 3 in September 2024 contrasts with today’s placement, indicating a multi-year comedown. Against this backdrop, Phat Panda holds rank 1 with an 18.99% YoY sales gain, widening the gap at the top, while Mama J's moved from rank 4 to rank 3 on 3.16% YoY growth; meanwhile, Legends stays at rank 2 despite a 16.90% YoY sales decline, signaling that ladder movement is possible even without growth. The combination of a 5-rank YoY slide and only a 2-rank quarterly recovery implies Artizen Cannabis is stabilizing below the top tier, requiring share wins to reverse a longer-term downshift from the September 2024 peak.

Notable Products
Blue Dream (3.5g) posted the steepest decline at -17.8% MoM while falling to rank 5, and Mother of Berries (3.5g) dropped -19.1% at rank 9, together signaling pressure in mid-pack Flower even as Dutchberry (3.5g) slid -13.1% at rank 2. In contrast, Jack Herer Pre-Roll 2-Pack (1g) rose +22.1% MoM to rank 4 while Dutchberry Pre-Roll 2-Pack (1g) held rank 1 at -6.2%, and four of the top ten are Pre-Roll SKUs, indicating mix resilience in ready-to-smoke formats. The $50,727 logged by Dutchberry (3.5g) alongside a +3.6% lift for Dutchberry (7g) at rank 7 suggests value pack retention even as premium eighths soften, implying Artizen Cannabis is tilting toward Pre-Roll-led velocity with selective Flower sizes maintaining basket relevance.
Top Selling Cannabis Brands






Data for this report comes from real-time sales reporting by participating cannabis retailers via their point-of-sale systems, which are linked up with Headset’s business intelligence software. Headset’s data is very reliable, as it comes digitally direct from our partner retailers. However, the potential does exist for misreporting in the instance of duplicates, incorrectly classified products, inaccurate entry of products into point-of-sale systems, or even simple human error at the point of purchase. Thus, there is a slight margin of error to consider. Brands listed on this page are ranked in the top twenty within the market and product category by total retail sales volume.

