.svg)


Market Insights Snapshot
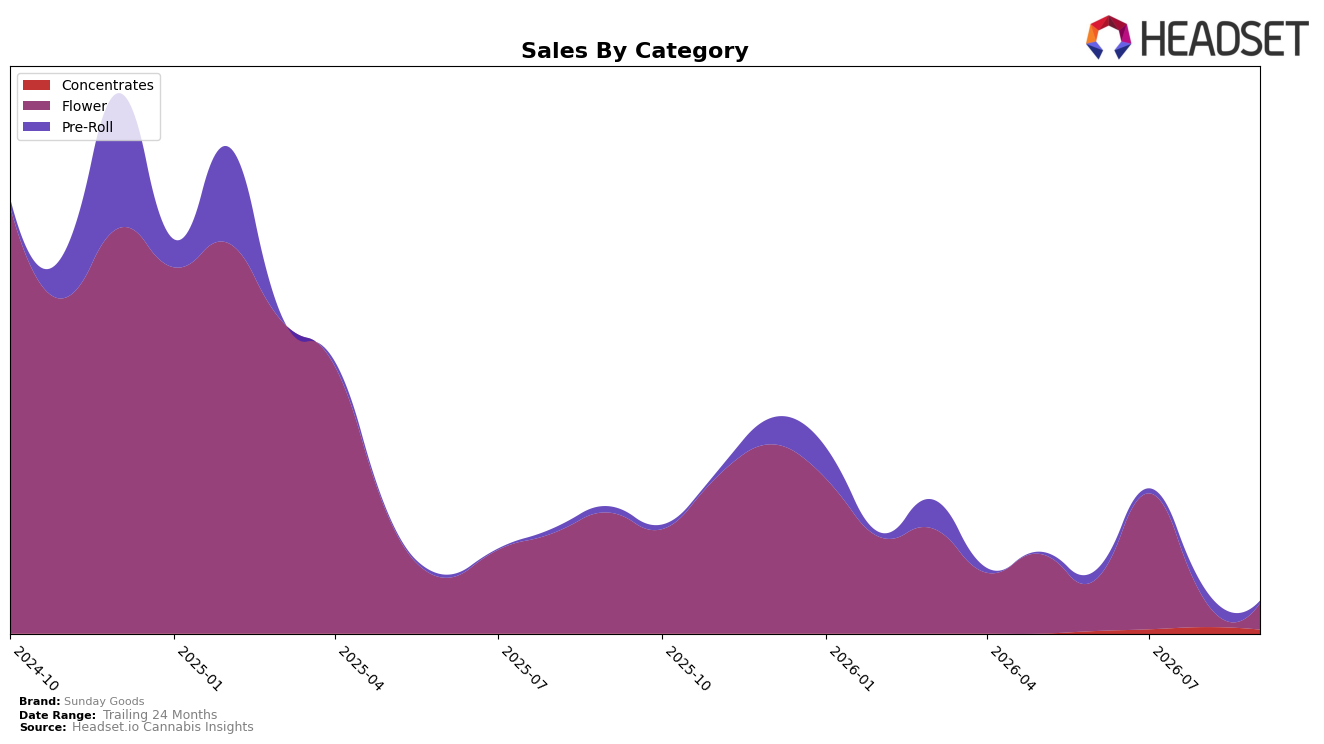
In September 2026, Sunday Goods concentrated 80.49% of sales in Flower while Pre-Roll accounted for 6.97% and Concentrates for 12.54%, a mix that skews further into Flower than typical mixed portfolios. Flower declined 78.53% year over year and slipped 2.58% month over month, while Pre-Roll fell 62.24% year over year and dropped 80.00% month over month; Concentrates lacked a year-over-year read but contracted 38.51% month over month. With an average Flower price of $21.83 alongside a brand-level average price up 4.57% year over year, the result is a narrowed demand base heavily dependent on Flower during a period of contraction, implying concentration risk rather than category diversification.
Given a Flower rank of 57 in Arizona and a 78.53% year-over-year Flower drop in September 2026, the current mix positions Sunday Goods as a lower-tier Flower participant rather than a balanced multi-category player. The 80.49% share in Flower combined with an 80.00% month-over-month decline in Pre-Roll and a 38.51% month-over-month decline in Concentrates indicates retreat from accessible entry formats, while a 2.58% month-over-month erosion in Flower suggests limited offset from the core. This pattern implies the brand is ceding breadth in favor of a single-category stance that compresses reach and limits cross-category traffic.
Competitive Landscape
Sunday Goods is ranked #57 in AZ Flower in September 2026, down 21 positions YoY from #36, and down 2 positions from June 2026’s #55; the brand’s peak was #8 in September 2024, placing its current slot 49 ranks below that high. In contrast, Just Flower holds #1 with a 29.0% YoY sales increase, while Loud Pax jumped from #51 YoY to #5 with a 2,181.5% YoY sales surge, indicating faster upward mobility among leaders than Sunday Goods’ recent two-rank slide over the last three months. The pattern implies Sunday Goods is losing relative shelf visibility as faster-rising competitors compress the middle tier, and the two-year fall from #8 to #57 suggests current positioning requires either assortment or pricing actions to arrest further rank drift.

Notable Products
Las Vegas Triangle Kush (14g) posted the largest move with a 406% month-over-month gain and entered September 2026 at rank 3, while Banana OG X Cookies N Cream Badder (1g) fell 87% to rank 10; this spread points to shifting demand from niche concentrates to bulk flower. Las Vegas Triangle Kush Badder (1g) also climbed 52% to rank 2, whereas Tropsanto #90 (3.5g) held rank 1 without a reported percentage change, indicating stability at the top alongside volatility in adjacent formats. With three Flower SKUs sitting in the top 10 and three Concentrates present but bifurcated by a 52% rise and an 87% drop, the mix indicates a pivot toward higher-volume flower as the growth engine and a winnowing of underperforming concentrate variants.
Top Selling Cannabis Brands






Data for this report comes from real-time sales reporting by participating cannabis retailers via their point-of-sale systems, which are linked up with Headset’s business intelligence software. Headset’s data is very reliable, as it comes digitally direct from our partner retailers. However, the potential does exist for misreporting in the instance of duplicates, incorrectly classified products, inaccurate entry of products into point-of-sale systems, or even simple human error at the point of purchase. Thus, there is a slight margin of error to consider. Brands listed on this page are ranked in the top twenty within the market and product category by total retail sales volume.

