Jun-2026
Sales
Trend
6-Month
Product Count
SKUs
Avg Price
YoY Sales Change
YoY Price Change
Market Insights Snapshot
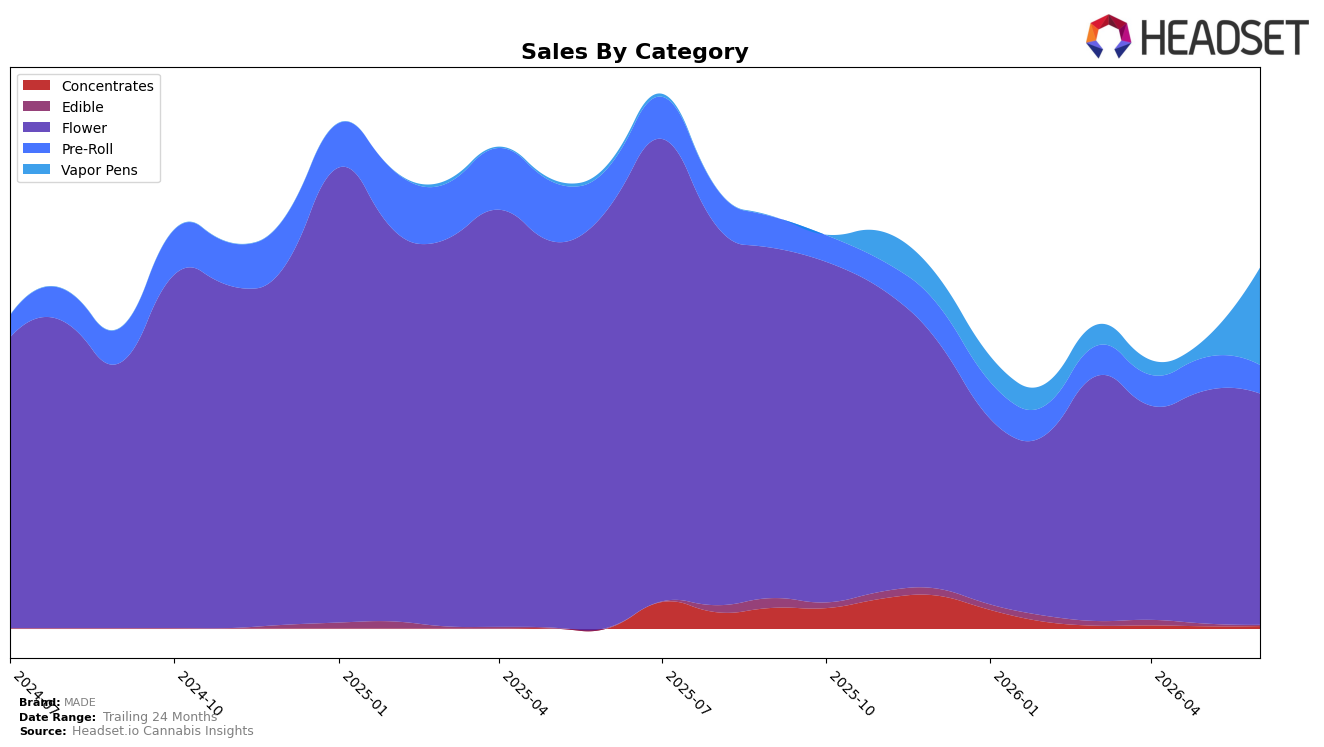
In June 2026, MADE’s category mix pivoted as Flower fell 44.9% YoY and 0.6% MoM while still holding 64.27% share, and Vapor Pens surged 2,911.1% YoY and 448.5% MoM to 26.97% share; Pre-Roll contracted 30.5% YoY and 14.2% MoM to 7.85% share, and Concentrates expanded 552.6% YoY with a 7.5% MoM gain to 0.69% share. Despite a brand-level sales decline of 22.4% YoY and an 8.2% YoY drop in average price to $26.85, category shifts indicate volume reallocation from Flower toward inhalables with faster momentum, implying the mix could offset price compression if Vapor Pens sustain triple-digit growth while Flower stabilizes.
These shifts reposition MADE toward a dual-engine portfolio anchored by a still-dominant but declining Flower base ranked 26th in Arizona and a rapidly scaling Vapor Pens line whose share expanded to 27.0% as Flower’s share settled near 64.3%. With Pre-Roll down 30.5% YoY and 14.2% MoM and Edible dropping 64.3% MoM even as it rose 204.0% YoY, the mix tilts to higher-velocity inhalables; the implication is that competitive differentiation will rely less on breadth and more on deep penetration in Vapor Pens and recovery in Flower, using Concentrates’ 552.6% YoY growth as a small but directional proof point for inhalable-led positioning.
Competitive Landscape
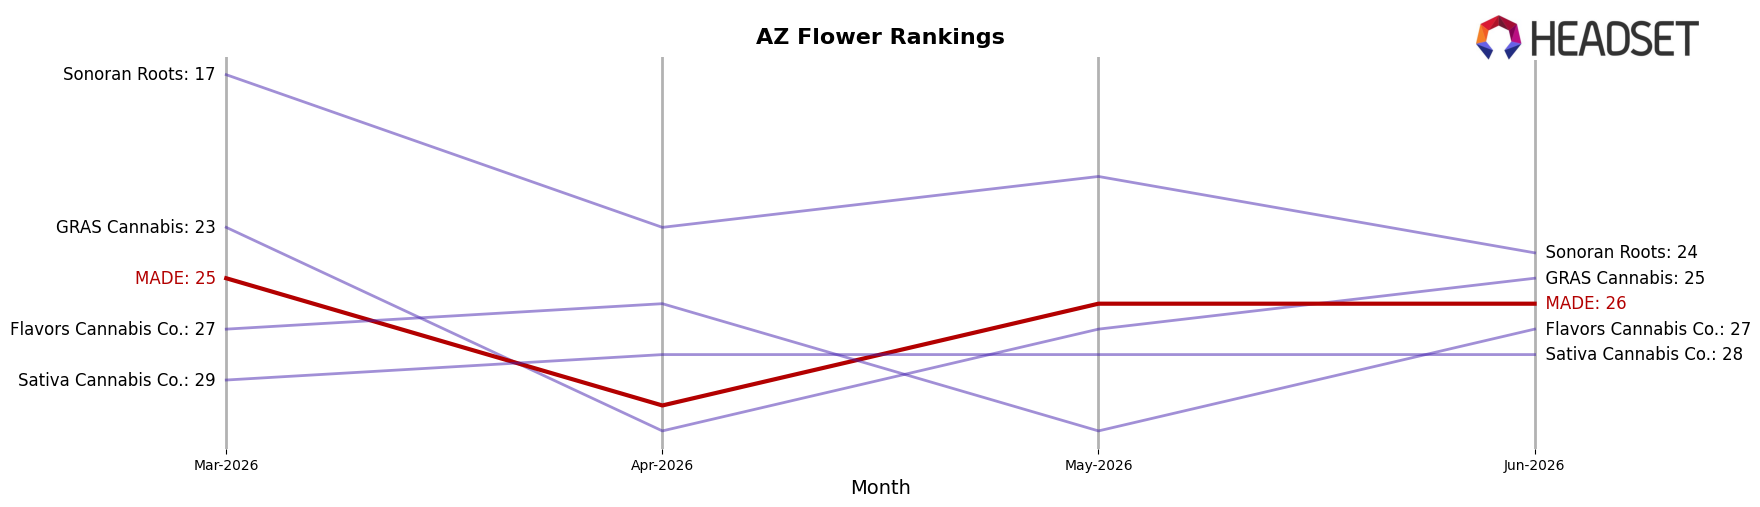
MADE sits at rank #26 in Arizona Flower for June 2026, down 2 positions year over year from #24, and off 1 spot from March 2026’s #25, while still trailing its peak of #17 from December 2024; in contrast, Just Flower held #1 both year over year and in June 2026 as its sales grew 13.0%, and The Pharm advanced from #5 to #4 alongside a 44.1% sales lift, indicating MADE’s flat-to-declining rank is being outpaced by competitors with clearer upward momentum, implying that without a share-accretive move, MADE’s trajectory points to gradual erosion within the top-30 tier.
Notable Products
Lou Lou Lemon (3.5g) leads with a -98.0% month-over-month collapse while still holding rank 1, and Red Dragon Pre-Roll 2-Pack (2g) drops -24.8% to rank 9, marking the steepest declines at the top and bottom of the leaderboard. In contrast, Gelonade (3.5g) climbs +17.6% at rank 2 while Pippen (3.5g) gains +10.6% at rank 4, and five of the top ten are Flower SKUs concentrated in 3.5g formats. This split between a -98.0% flagship fall and double-digit gains in adjacent Flower SKUs implies a pivot toward breadth within core Flower rather than reliance on a single hero, with risk that rank 1 is held on thin volume despite a $26,166 month.
Top Selling Cannabis Brands
Data for this report comes from real-time sales reporting by participating cannabis retailers via their point-of-sale systems, which are linked up with Headset’s business intelligence software. Headset’s data is very reliable, as it comes digitally direct from our partner retailers. However, the potential does exist for misreporting in the instance of duplicates, incorrectly classified products, inaccurate entry of products into point-of-sale systems, or even simple human error at the point of purchase. Thus, there is a slight margin of error to consider. Brands listed on this page are ranked in the top twenty within the market and product category by total retail sales volume.

